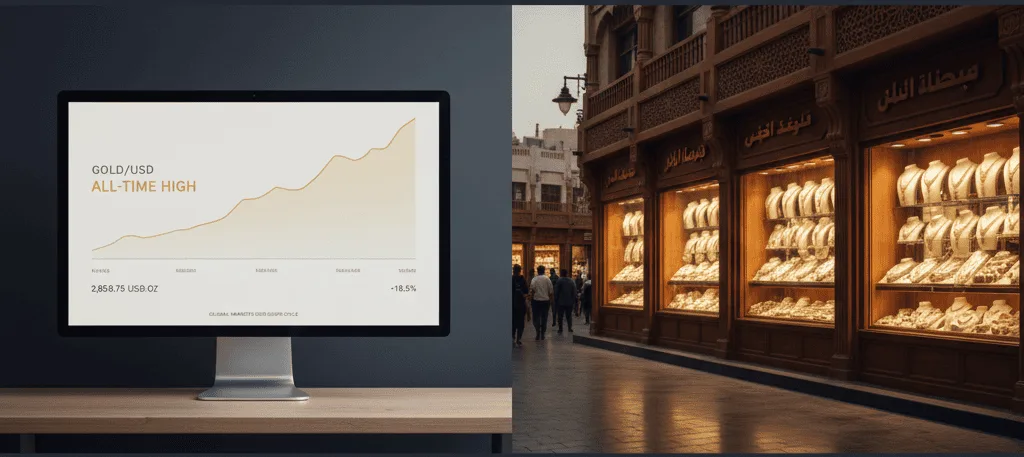
In 2025, watching the gold live rate turned into a daily ritual for everyone from reserve managers to retail buyers weaving through Dubai’s Gold Souk. What began as a steady macro bid became a full-blown regime shift: gold re-priced not just as an inflation hedge, but as monetary infrastructure in a more fragmented world.
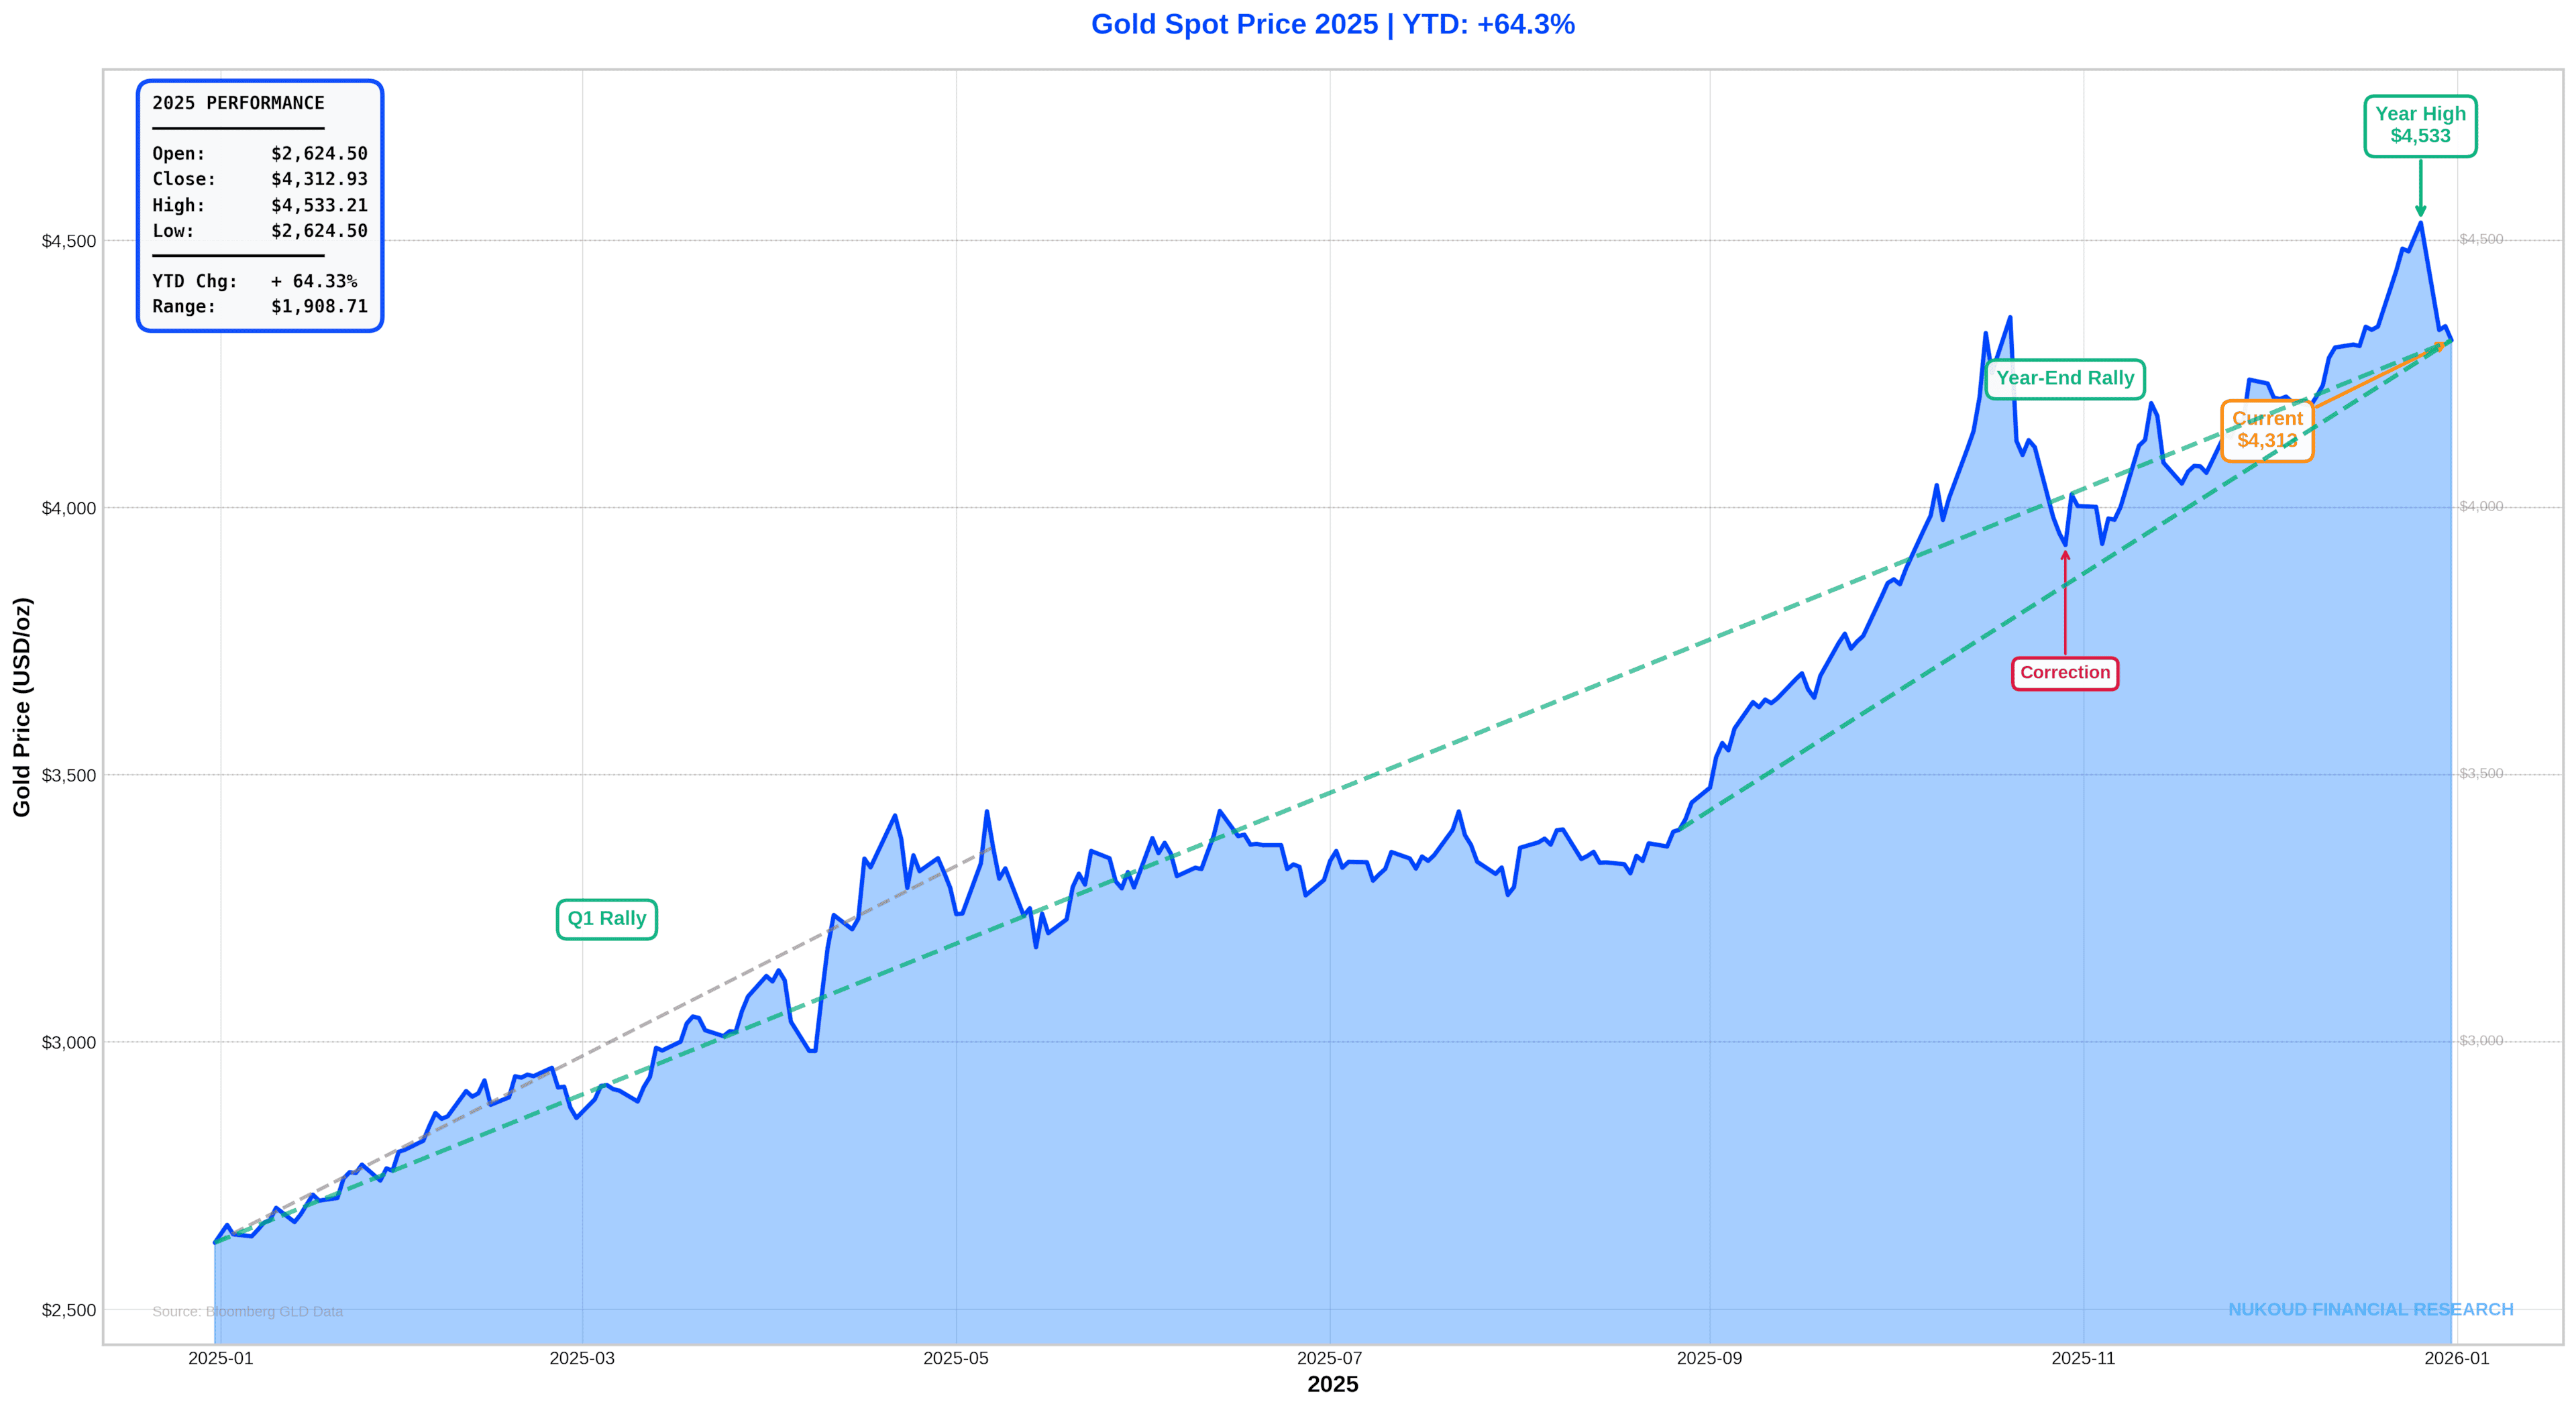
By late December, spot gold was trading in a volatile $4,350–$4,450/oz range after printing intrayear highs near $4,550/oz. Whether you were looking at a Bloomberg terminal or a jewelr’s board in Deira, the signal was the same: the gold live rate was no longer just a commodity quote it was the macro narrative.
1) The 2025 tape: a market that climbed in steps, not a straight line
Gold’s 2025 rally was anything but subtle. It unfolded in distinct, psychologically important steps, each one unlocking a new layer of demand.
The reason it felt so powerful was not just the magnitude of the move, but its visibility as the gold live rate was on screens everywhere, reinforcing momentum and anchoring expectations in real time.
In Q1/Q2, the metal moved decisively through $2,500/oz and then $3,000/oz, levels that had previously capped multi-year rallies. This phase was driven largely by macro anticipation and expectations of U.S. rate cuts, falling real yields, and persistent geopolitical stress, rather than panic.
Importantly, volatility remained contained early on, which encouraged incremental positioning by institutions rather than speculative blow-ins.
By Q3 into early October, the pace accelerated sharply. J.P. Morgan characterizes this stretch as “ferocious,” noting that gold was up roughly ~55% year-to-date by 20 November 2025, and ~18% since the end of August alone. Critically, this surge was demand-led, not supply-driven. Mine output did not meaningfully respond, reinforcing the sense of scarcity and amplifying price sensitivity to incremental flows.
Gold’s super-cycle was strong enough to absorb corrections, but volatile enough to punish complacency and the outlook may be constructive, but the path as the tape repeatedly showed can be violent.
2) Who’s buying and why the buyer mix changed in 2025
Gold’s ability to rally at record prices ultimately comes down to one thing: the marginal buyer changed.
In prior cycles, jewelry demand acted as both a stabilizer and a ceiling, especially in the GCC and MENA. In 2025, jewelry weakened sharply but it stopped being the price setter. Instead, the market’s center of gravity shifted toward less price-sensitive buyers including central banks, ETFs, futures investors, and bars-and-coins buyers treating gold as a financial asset rather than a consumer good.
Our data captures the scale of that shift. In 3Q25, combined investor and central bank demand reached roughly ~980 tonnes, more than 50% above the average of the preceding four quarters (around ~640 tonnes).
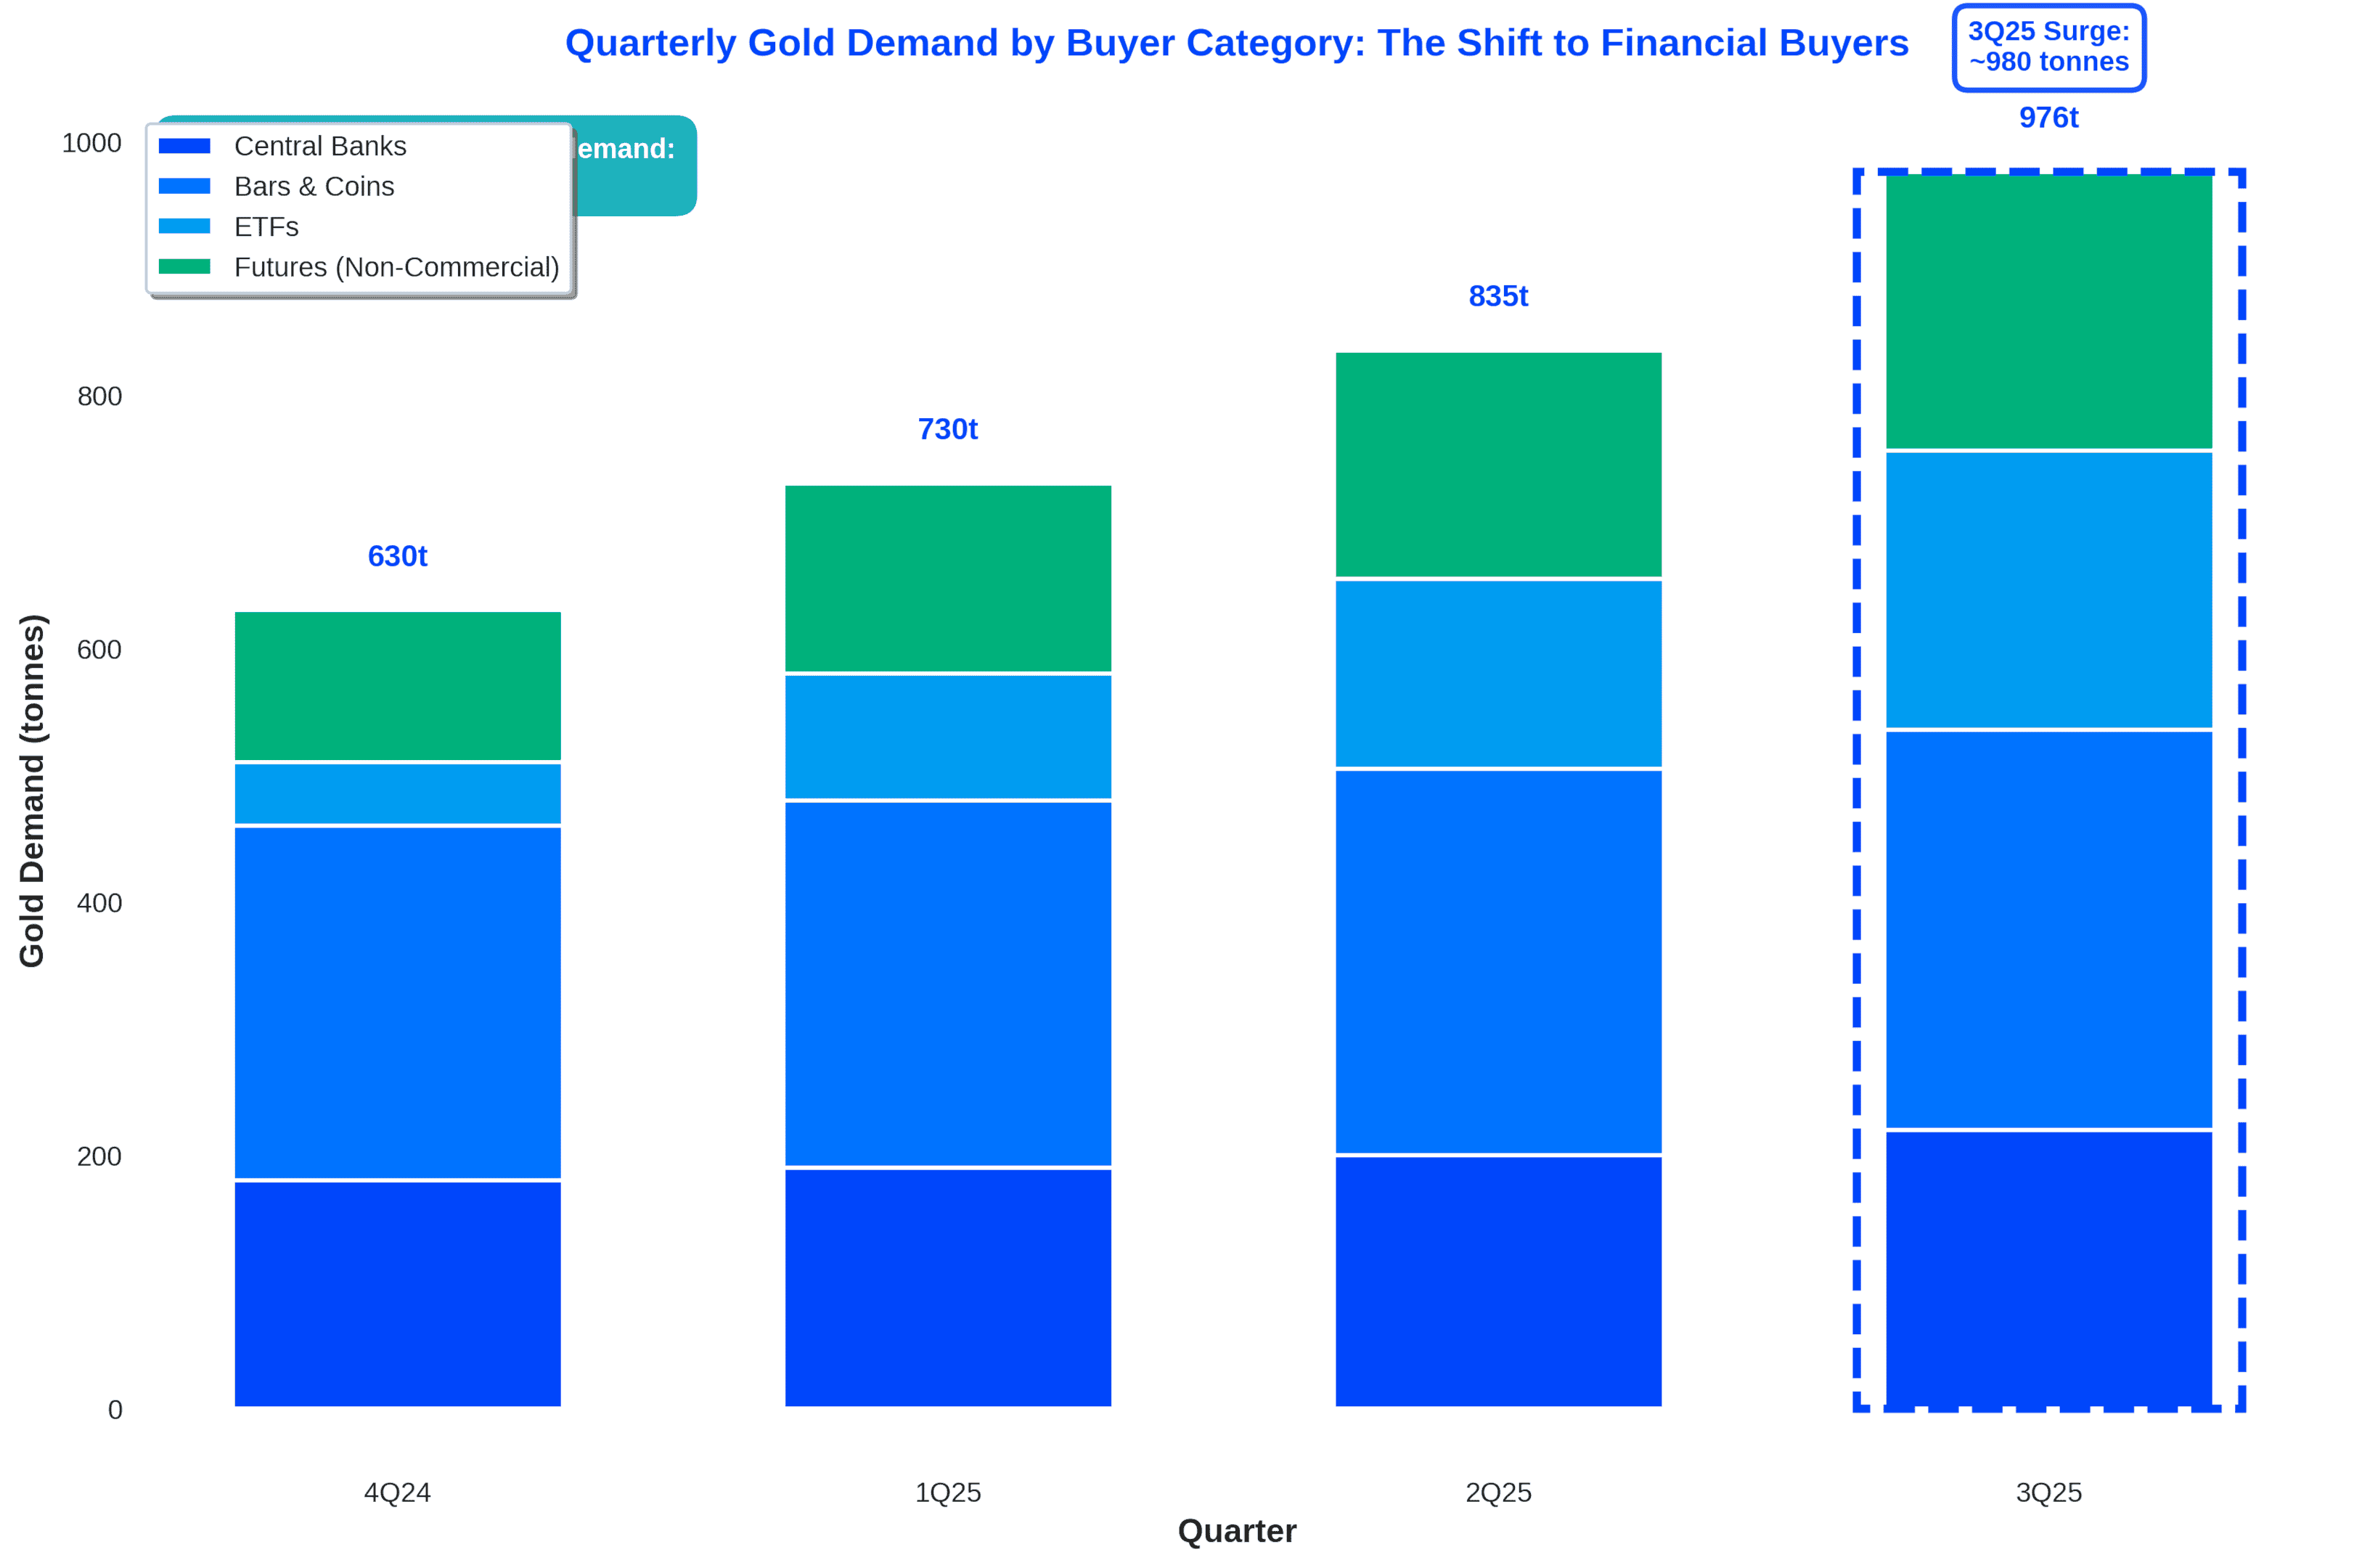
In value terms, the magnitude is even clearer. At an average gold price of roughly $3,458/oz in 3Q25, that demand translated into approximately $109bn of quarterly inflows, nearly 90% higher in real terms than the prior four-quarter average of about $58bn. In other words, gold was absorbing capital at a pace normally associated with major asset classes, not defensive hedges.
The composition of demand explains why the rally proved resilient:
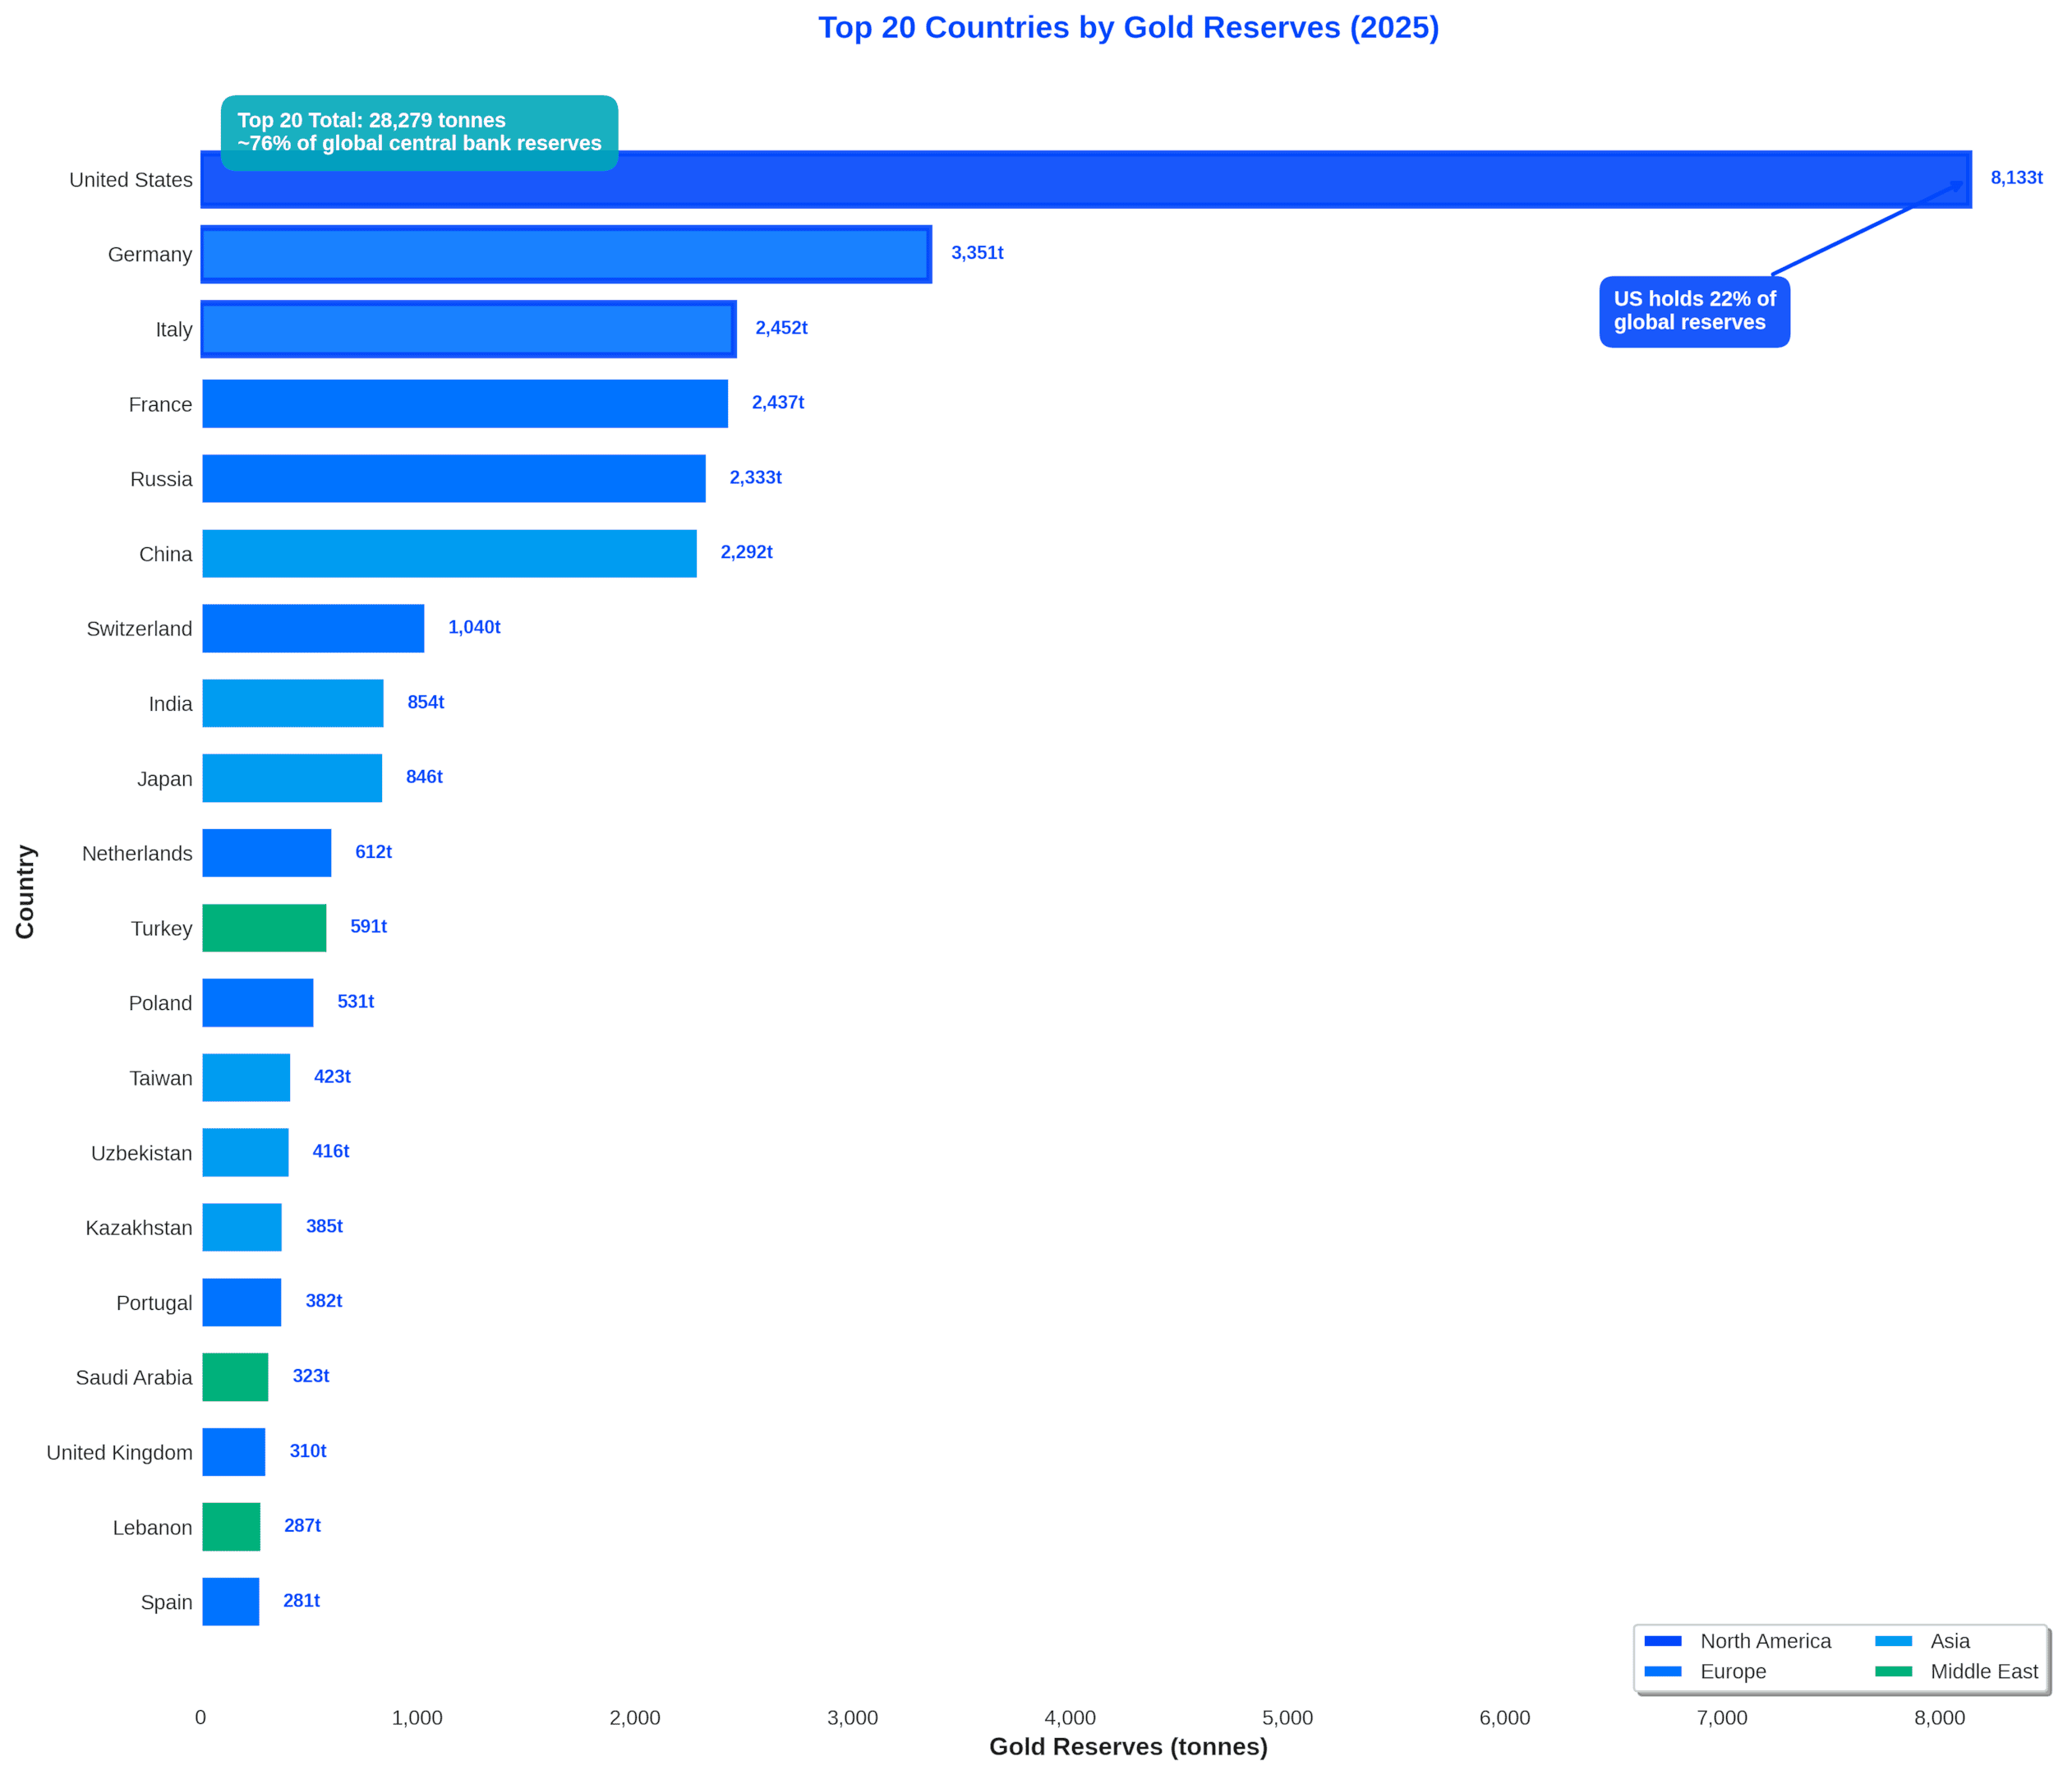
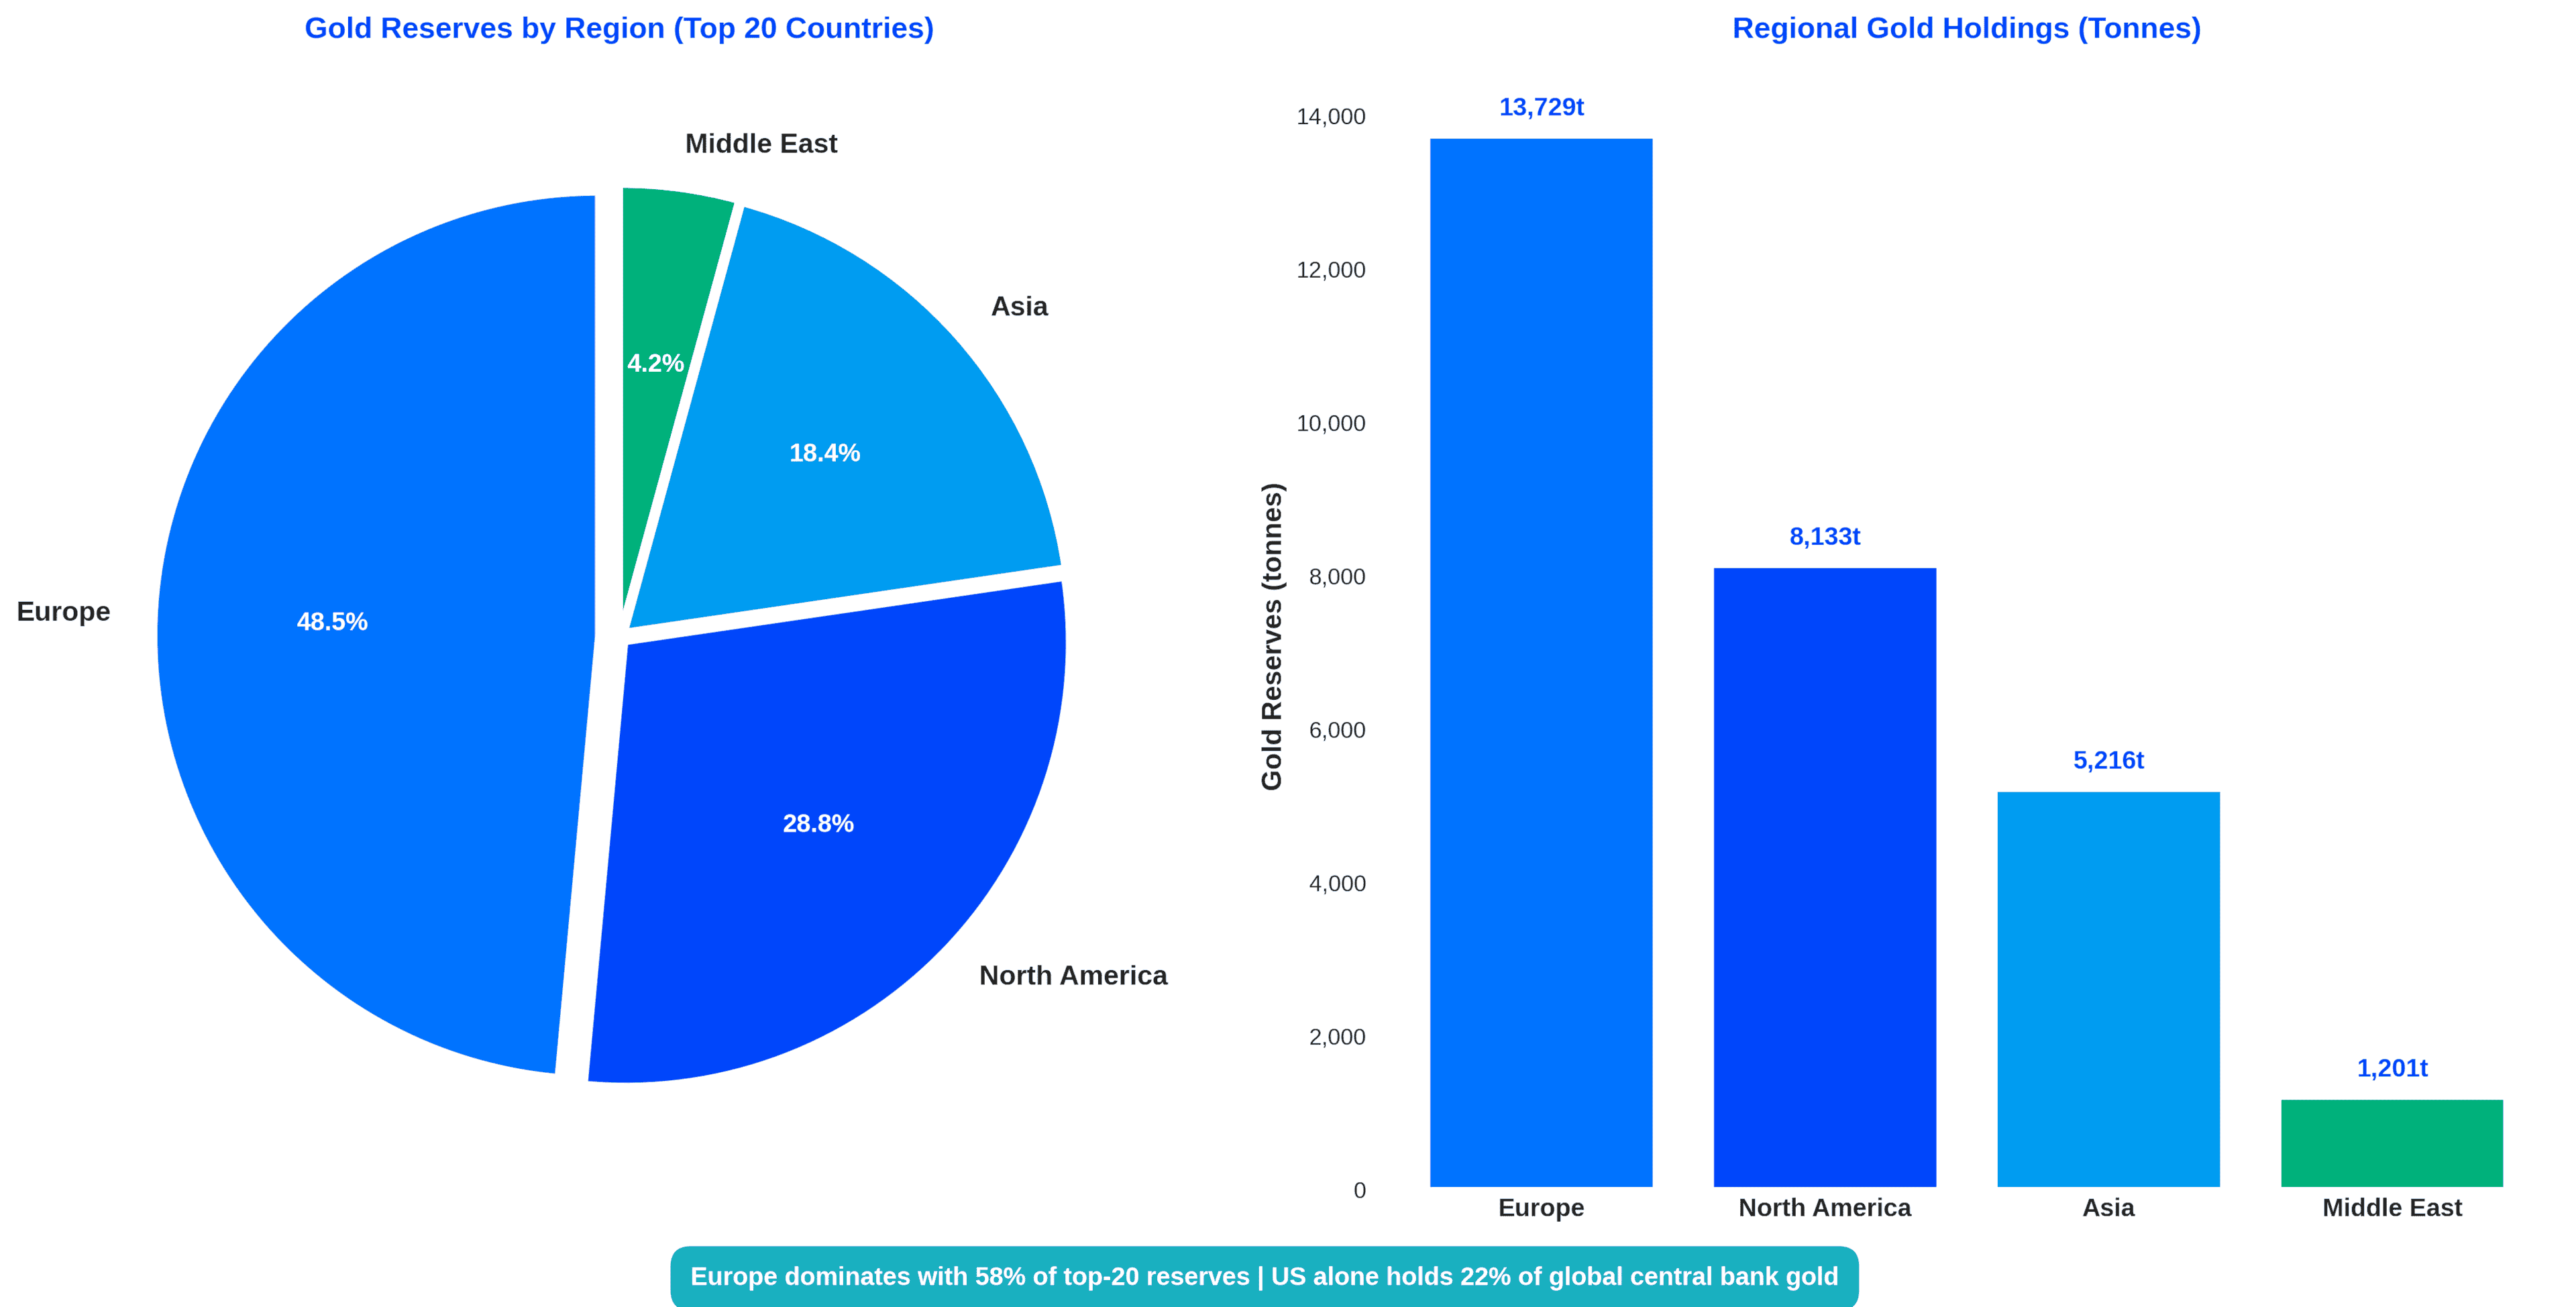
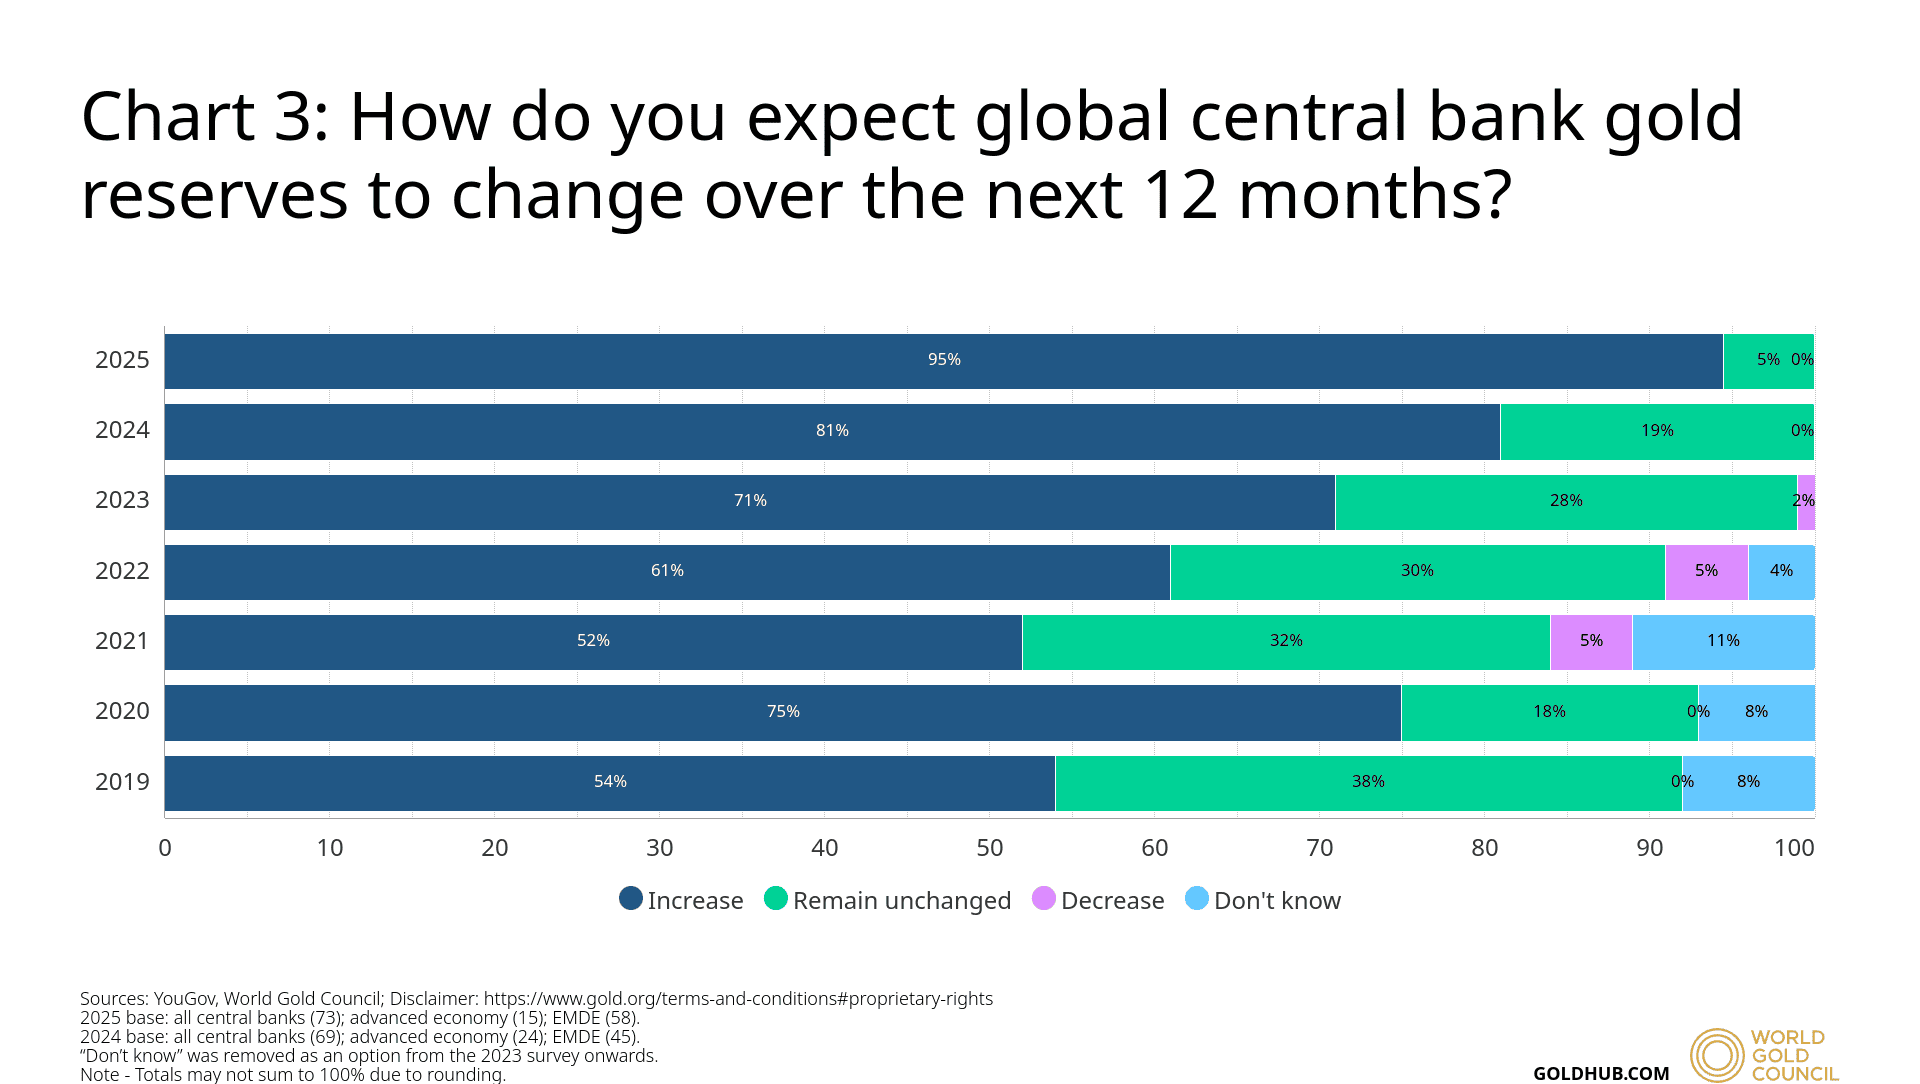
- Central banks: Official-sector buying remained the structural anchor. Net purchases in 2025 were running in the high hundreds of tonnes, broadly consistent with the ~1,000-tonne annual pace seen in recent years. This slow-moving but highly credible demand was driven by reserve diversification, geopolitical risk management, and reduced reliance on the U.S. dollar.
- Bars and coins: Physical investment demand stayed robust despite higher prices. Bar and coin purchases totaled several hundred tonnes in 2025, with strength concentrated in non-Western markets and among high-net-worth buyers. This segment proved far less price-sensitive than jewelry and acted as a steady absorber of supply.
- ETFs: After years of net outflows, physically backed gold ETFs reversed course. ETF inflows in 2025 reached the high hundreds of tonnes, with the strongest buying concentrated in the first half of the year as rate expectations shifted and portfolio hedging demand broadened. ETFs became one of the main transmission channels linking macro narratives to the gold live rate.
- Futures and derivatives: Non-commercial positioning expanded materially during breakout phases. Speculative net length increased by several hundred tonnes on a gold-equivalent basis, amplifying upside momentum when key levels such as $3,500 and $4,000 per ounce were breached and accelerating pullbacks during risk-off episodes.
The result was a market where weakness in jewelry demand (down sharply year-on-year) no longer dictated direction. Gold in 2025 was a portfolio asset with multiple, reinforcing sources of demand instead of its previous position as a consumer commodity.
3) Supply and demand dynamics: why higher prices didn’t “solve” the market
In most commodities, a price shock eventually cures itself. Higher prices incentivised production, suppress demand, and bring the market back toward balance. Gold in 2025 once again demonstrated why it sits outside that framework.
On the supply side, the constraint is structural. We emphasize that gold mine supply is relatively inelastic, even at record prices. Global mine production typically grows at low single-digit rates annually, and new projects often require 7-10 years from discovery to commercial output. As a result, the surge in demand during 2025 ran into a supply base that was effectively fixed in the short term.
On the demand side, the story is more complex and more revealing. Jewelry remains a large component of gold consumption, accounting for roughly 40–50% of annual demand in a typical year. In 2025, that segment weakened sharply as record prices discouraged discretionary buying.
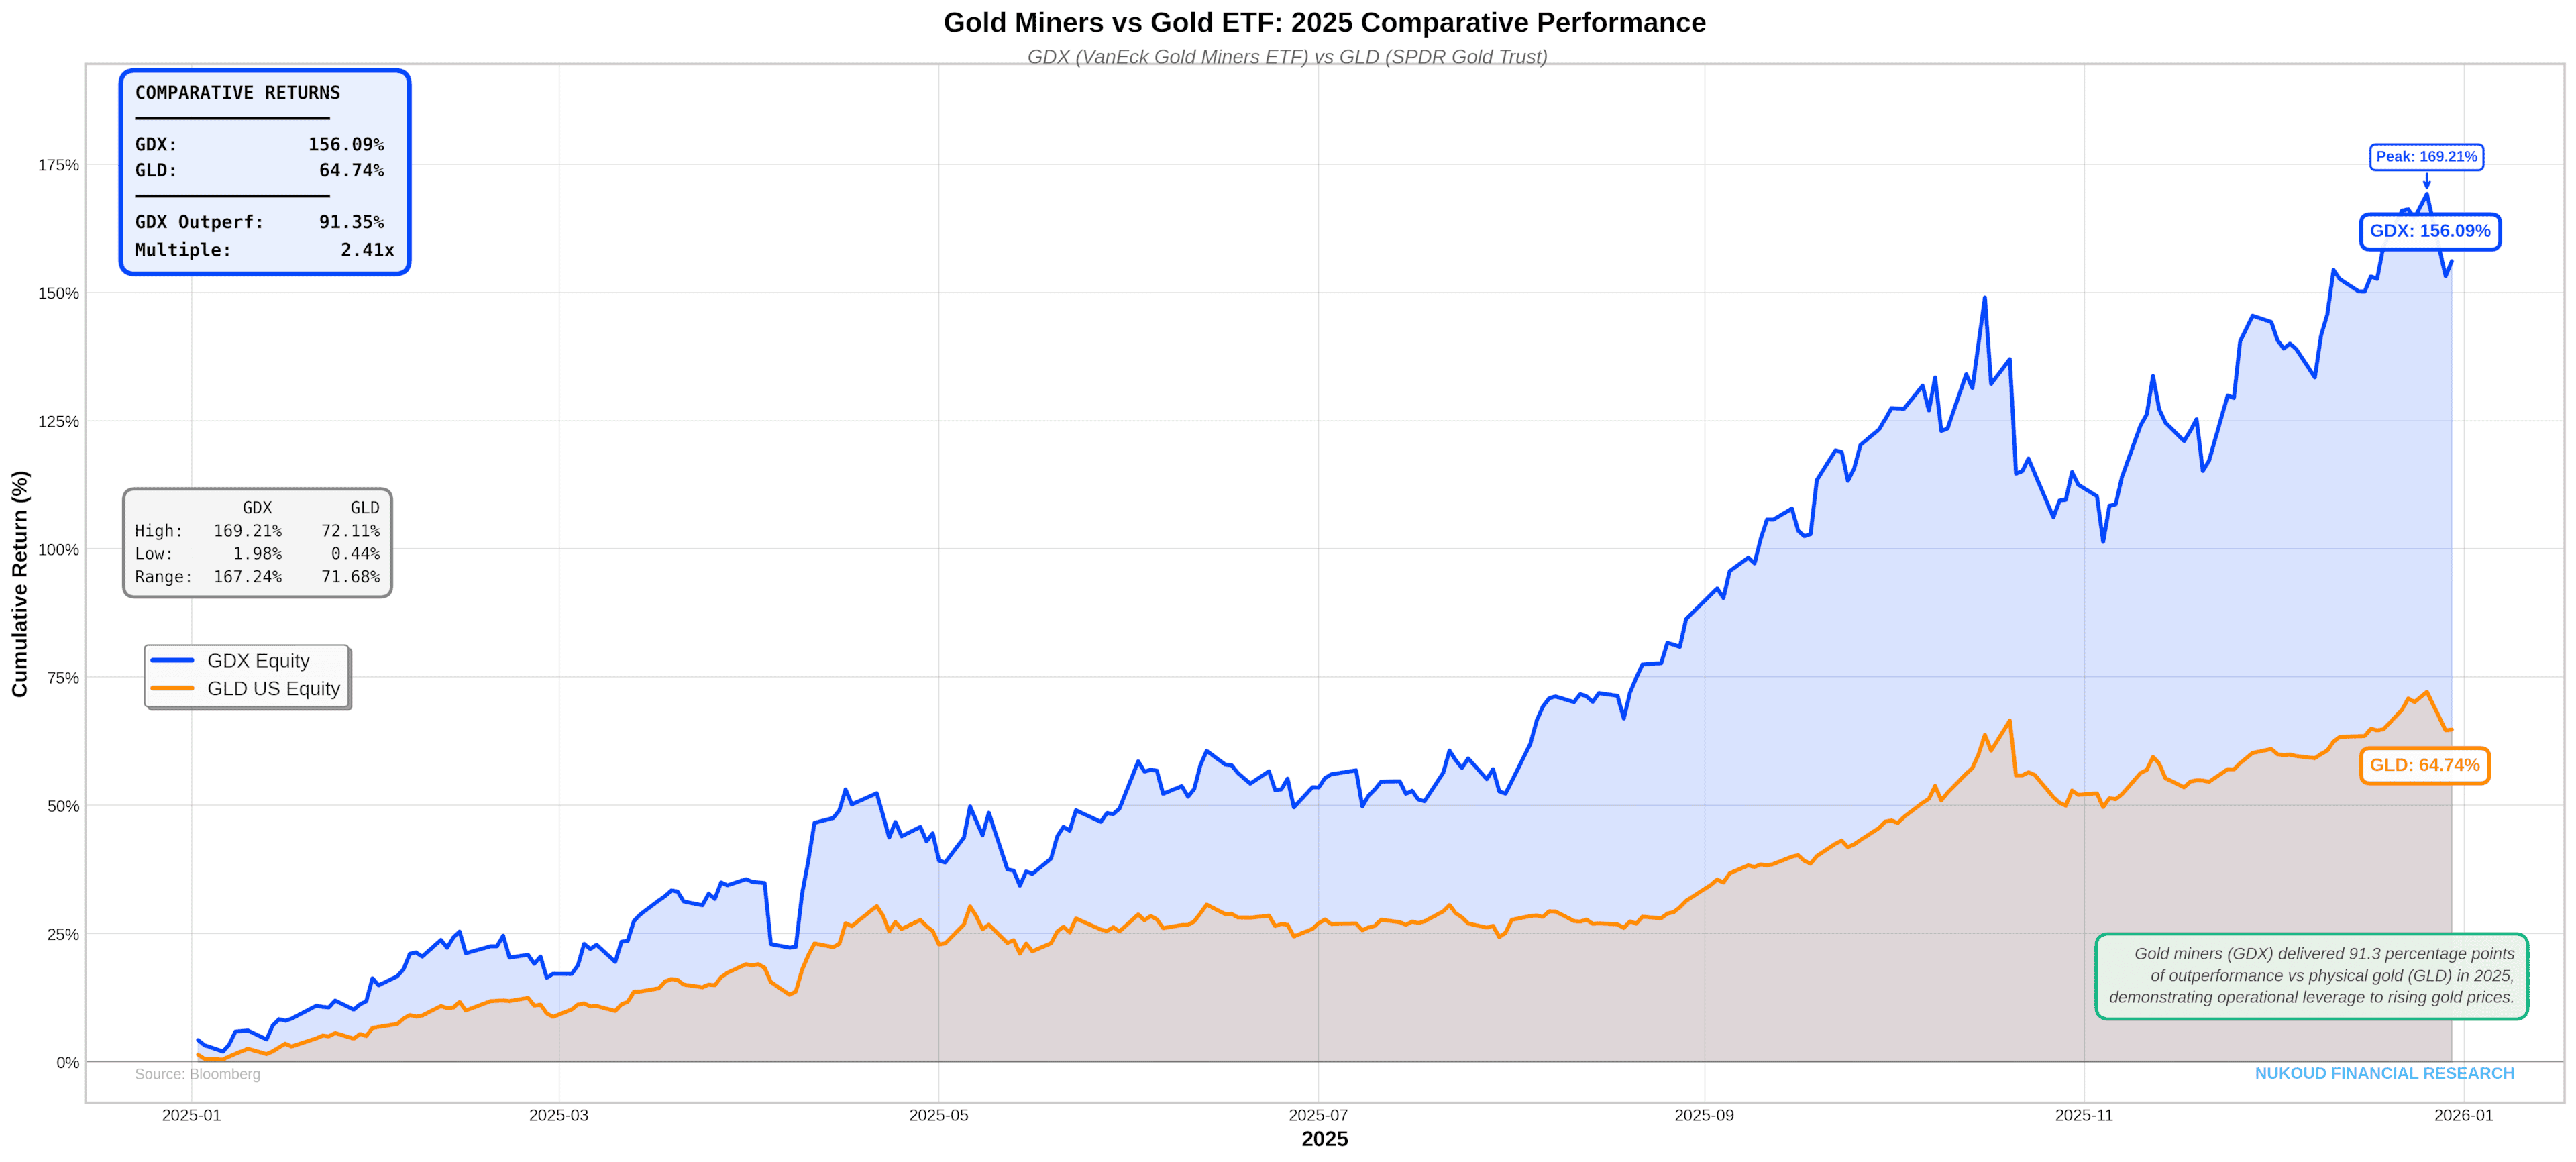
This inelasticity of supply has been reflected through the outperforming of gold miners over physical gold
The data are clear:
- Jewelry demand fell about 19% year-on-year in 3Q25.
In past cycles, a decline of that magnitude would likely have capped prices. In 2025, it didn’t because jewelry was no longer the marginal price setter.
Instead, the shortfall was overwhelmed by investment and official-sector demand. We estimate that in 3Q25, combined central bank and investor demand reached roughly 980 tonnes, compared with an average of around 640 tonnes over the prior four quarters resembling an increase of more than 50%.

Put differently:
- Jewelry demand fell by tens of tonnes.
- Investment and official-sector demand rose by hundreds of tonnes.
Gold can rally even as jewelry retreats, because the dominant buyers are no longer consumers responding to price but institutions responding to macro risk.
4) The USD and U.S. rates: still relevant, but no longer decisive
Gold’s relationship with the U.S. dollar and U.S. real yields remains one of the most closely watched macro linkages and in 2025, it still mattered. But it was no longer sufficient to explain the scale of the move.
The classic mechanism held early in the year. As expectations of Federal Reserve easing grew and real yields declined, the opportunity cost of holding non-yielding gold fell. J.P. Morgan explicitly links ETF inflows to changes in U.S. 10-year real yields, confirming that rates continue to influence institutional positioning.
However, the numbers show that rates alone cannot explain 2025.
ETF demand in 2025 materially outperformed what historical rate-based models would have implied. In other words, even after accounting for falling real yields, ETF inflows were too large to be explained by monetary policy expectations alone.
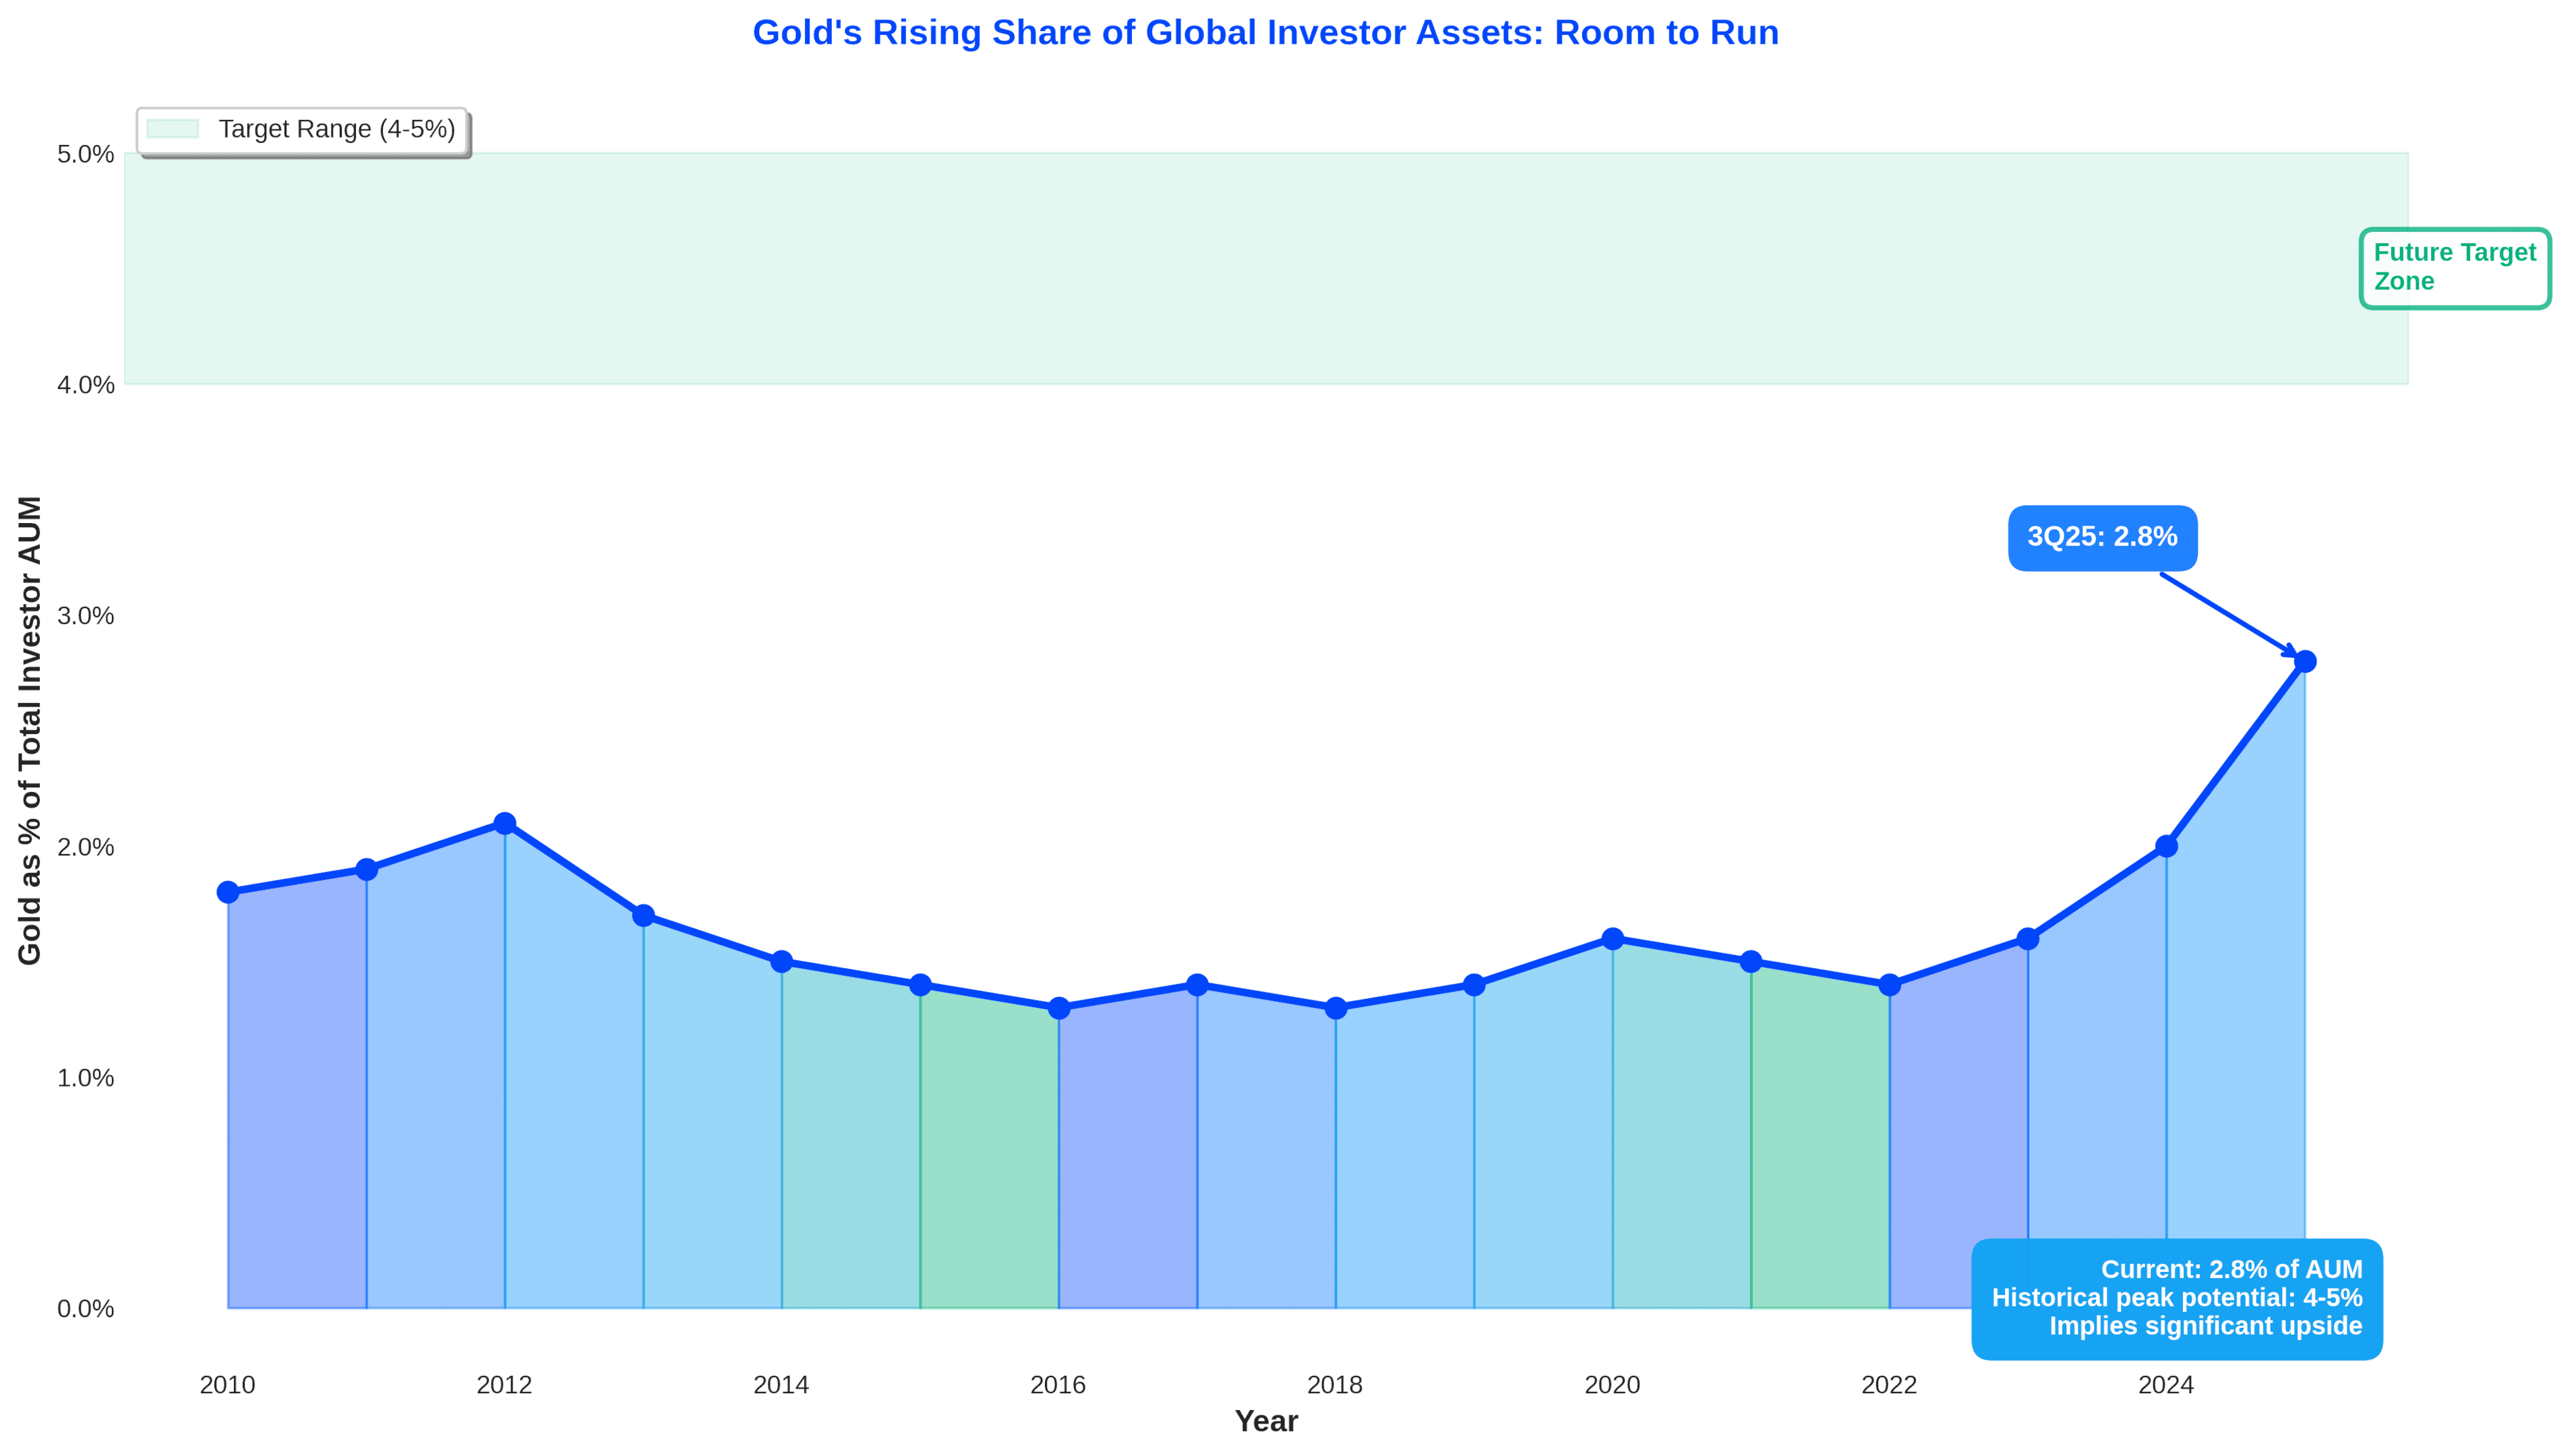
This divergence is critical. It signals a shift from cyclical allocation to structural diversification.
We attribute this to a broader set of drivers that sit outside traditional rate frameworks:
- Rising concern over debt sustainability in major economies
- Elevated policy and fiscal uncertainty
- Increased sensitivity to geopolitical risk and sanctions exposure
- A desire for assets with no counterparty risk
The buyer base had widened. Gold was no longer just reacting to rates, it was being accumulated as portfolio insurance.
The implication for investors is nuanced but important. Rates still matter at the margin, especially for ETFs, but gold’s 2025 performance shows that its demand base has become less dependent on any single macro variable.
That evolution, more than any Fed decision, is what allowed the gold live rate to remain resilient, volatile, and structurally supported throughout the year.
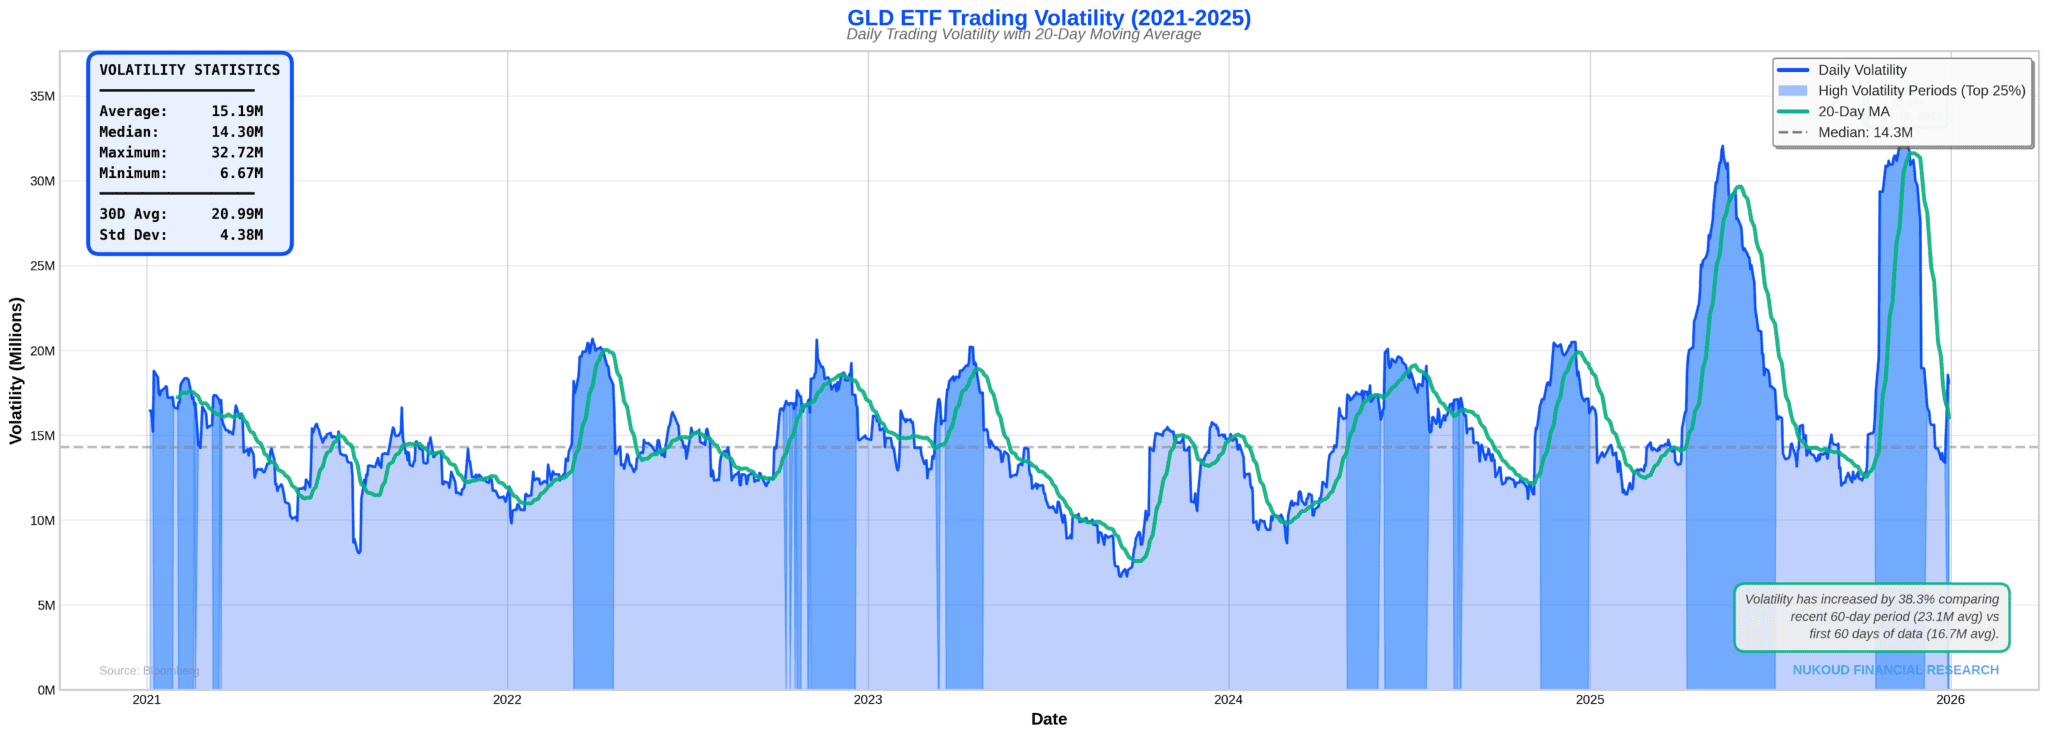
5) Beware from high volatility gold markets
One of the defining features of gold’s 2025 super-cycle was not just how far prices moved, but how violently they moved along the way. This is a point your reviewers flagged correctly and it is echoed directly in J.P. Morgan’s analysis.
Several forces amplified volatility in 2025:
- Crowded positioning: As gold broke successive milestones ($3,500, $4,000), futures and ETF positioning became increasingly one-sided, raising sensitivity to any shift in narrative.
- Macro headline risk: Peace-talk headlines, Fed communication, and geopolitical escalations repeatedly triggered fast repricing, even when the underlying trend remained intact.
- Leverage in futures markets: Non-commercial futures length expanded materially during breakout phases, increasing the risk of forced selling during margin changes or rapid price drops.
- Liquidity effects: As J.P. Morgan notes, late-cycle rallies tend to coincide with thinner liquidity, making price moves more abrupt.
The result was a market capable of rising tens of percent over months while still suffering sharp, multi-day drawdowns. Intra-year pullbacks of 5-8% did not break the broader uptrend, but they underscored a key reality of 2025. Gold’s bull case remained intact, yet it was structurally volatile, with concentrated flows and fast-moving narratives amplifying short, uncomfortable corrections along the way.
6) The GCC lens: where the gold live rate meets the Gold Souk and the exchange
The GCC was not a passive observer in 2025’s gold rally. It sat at the intersection of reserve strategy, bullion logistics, and real-time price transmission, making the region one of the most visible conduits through which the global gold live rate translated into economic behavior.
Dubai’s Gold Souk: real-time transmission of global prices
Dubai’s Gold Souk functioned as the physical interface to the global gold live rate. Throughout 2025:
- Retail price boards repriced almost instantaneously with international spot moves, reinforcing price transparency.
- High prices suppressed jewelry volumes, but simultaneously boosted recycling flows as households monetized existing holdings.
- Demand shifted toward bars and investment-grade products, reflecting a broader regional pivot from ornamental to financial gold.
In a $4,000-plus gold environment, the Gold Souk increasingly resembled a retail extension of the global bullion market, rather than a traditional consumer bazaar.
How GCC investors accessed gold through ETFs
Alongside physical markets, gold’s 2025 rally was increasingly expressed through exchange-traded funds, particularly in Saudi Arabia and across international platforms.
For domestic investors, Albilad Gold ETF provided a key access point. Listed on Tadawul under symbol 9405, the fund is marketed as the region’s first Shariah-compliant commodity gold ETF and tracks physical gold via the DGCX Spot Gold Price (DGSG). With a reported TER of around 0.41%, it allowed Saudi investors to gain exposure to the gold live rate without storage or handling friction.
Many GCC investors also used global ETFs. SPDR Gold Shares (GLD) offered highly liquid, physically backed exposure that closely tracked spot gold, while VanEck Gold Miners ETF (GDX) provided more leveraged exposure through gold mining equities, carrying higher volatility but greater upside sensitivity.
Together, these vehicles show how the 2025 gold super-cycle was accessed not only through jewellery and vaults, but through modern financial instruments that reprice continuously with the gold live rate.
Why this matters for the broader narrative
Taken together, volatility and GCC market structure reinforce the same conclusion: gold in 2025 was no longer a slow-moving store of value. It was a live, tradable macro asset, transmitted in real time from futures markets to ETFs, and from central bank balance sheets to the Gold Souk.
That duality, physical tradition on one side, financial modernity on the other, is precisely what makes the GCC central to the gold story, and why the gold live rate became something investors didn’t just check occasionally, but watched constantly.
| Metric | Number | “As of” | Why it matters |
|---|---|---|---|
| Gold performance | ~+55% YTD | 2025-11-20 | Confirms magnitude of the move mid-Q4 |
| 3Q25 investor + central bank demand | ~980 tonnes | 3Q25 | Flow shock that powered the late-year surge |
| 3Q25 demand value | ~$109bn | 3Q25 | Shows scale in dollars, not just tonnes |
| 3Q25 split (CB / bars&coins / ETFs / futures) | ~220 / 316 / 220 / 220 tonnes | 3Q25 | Identifies the buyers |
| Jewellery demand | -19% YoY | 3Q25 | Explains the consumer slowdown without breaking the bull case |
| Albilad Gold ETF | 9405, Shariah-compliant; benchmark DGSG; TER ~0.41% | latest issuer materials available | Local access channel tied to the gold live rate |
A forward-looking kicker
Looking beyond 2025, the structural case for gold remains intact and, in many respects, unfinished. The same forces that powered this year’s rally show few signs of reversal, from official-sector diversification and geopolitical fragmentation to investors’ growing preference for assets that sit outside the traditional financial system. Again st that backdrop, market projections increasingly point toward gold pushing toward the $5,000 per ounce region by late 2026 as reserve accumulation and portfolio hedging continue to absorb available supply.
The lesson from 2025 is clear. Gold’s super-cycle can continue, but it will do so in fits and starts that test conviction. For investors, policymakers, and consumers across the GCC, that reality reinforces a simple truth. Gold is no longer just a long-term store of value. It is a living macro asset, watched in real time and increasingly embedded in the financial architecture of a more uncertain world.