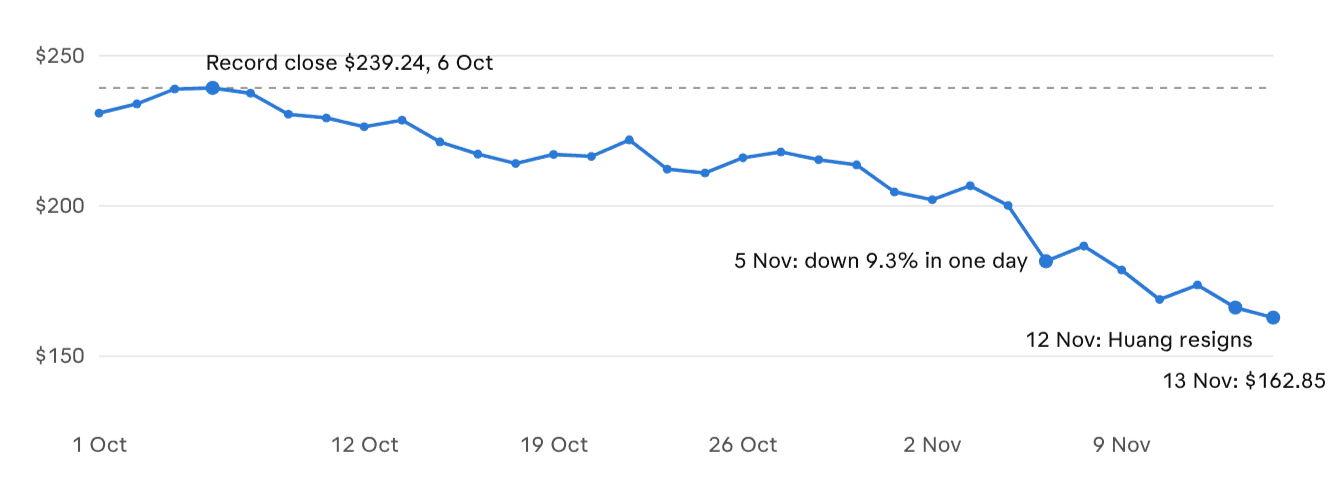
Nvidia's 32% share price decline has raised questions about whether the AI giant is becoming a buying opportunity or whether investors are reassessing its growth prospects. The stock closed at $162.85 on 13 November, down from its October record close of $239.24, despite quarterly revenue surging 106% year on year to $96.2 billion.
A viral 'Affair Rally' chart has added an unusual twist to the debate surrounding CEO Jensen Huang's departure. It also raises a broader question: how have other technology companies performed after executives became embroiled in similar personal controversies? Did their share-price declines eventually present buying opportunities? For GCC investors, Nvidia's correction raises another question: how much exposure can they access through ETFs? Available options include Albilad MSCI US Tech ETF and Lunate S&P US Shariah Growth ETF, as well as GQGU, which is scheduled to cross-list on ADX on 19 November, and KraneShares AGIX, which is also listed on ADX. We compare their holdings, fees, and performance to assess the different ways investors can approach the Nvidia dip.
The viral 'Affair Rally' chart
Could a CEO's personal controversy precede a rally in the company's stock? A viral chart circulating on social media suggests an unusual pattern. It links reported personal controversies involving executives at Amazon, Microsoft, SK Group, and Alphabet to subsequent share price gains, then turns its attention to Nvidia CEO Jensen Huang.
The 'Affair Rally' Stock Market Chart: Amazon, Microsoft, Nvidia and Other Stocks Compared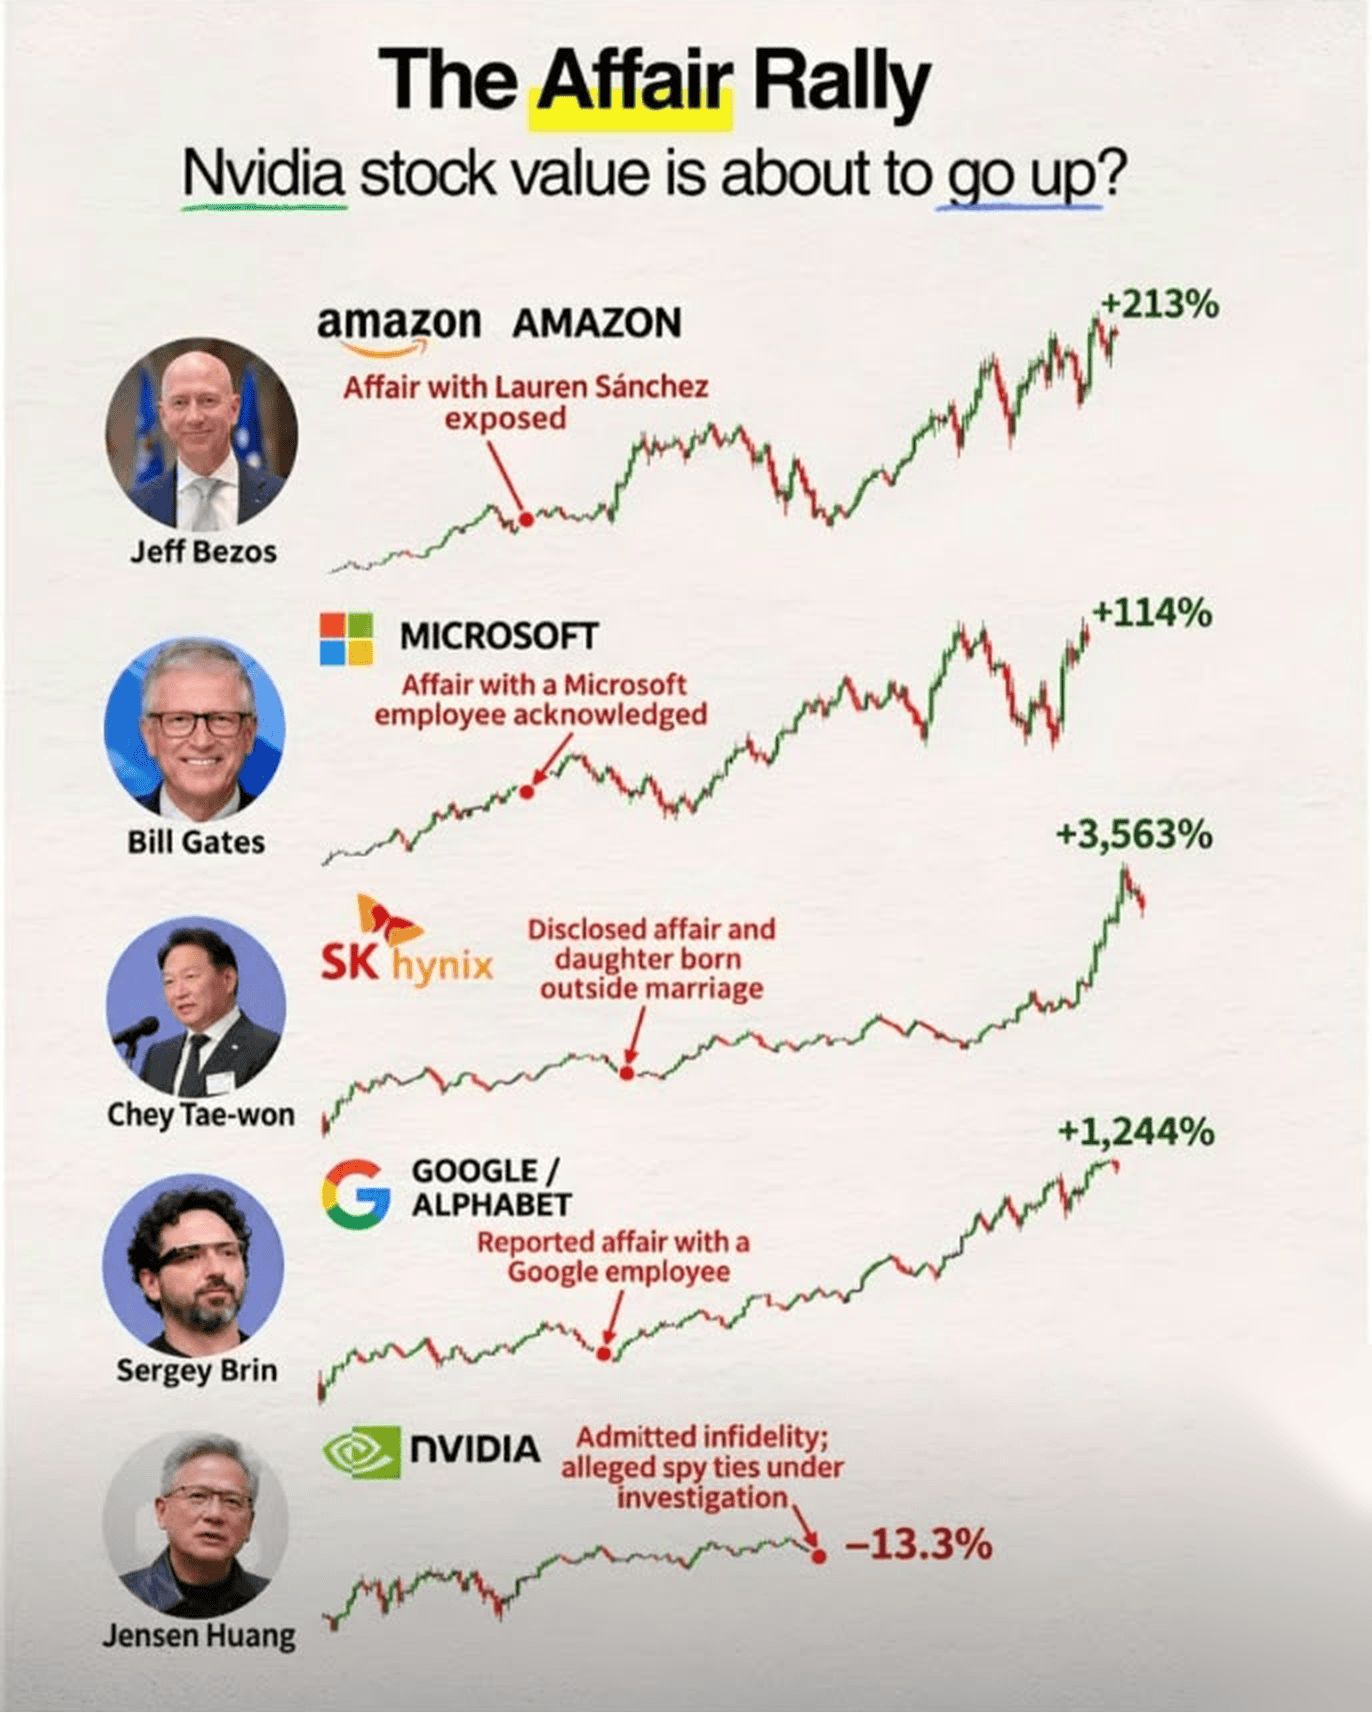
Source: Chart published by Yash Bedmutha on LinkedIn. Figures and annotations are reproduced as shown in the original graphic and have not been independently verified.
The graphic is intriguing, but its investment implications are far less convincing. It provides no dates, measurement periods, benchmarks, or sources for the returns it displays. The five examples are selectively chosen, and there is no evidence that the executives' personal lives caused their companies' share prices to rise. Broader market conditions, earnings growth, and changing investor expectations offer much more relevant explanations for stock performance. The chart's reported 13.3% decline in Nvidia is also outdated: the stock closed at $162.85 on 13 November, approximately 32% below its 6 October record close.
Huang's situation nevertheless introduces a separate question about corporate governance and investor confidence. Reuters reported that he acknowledged being unfaithful and that Nvidia's independent directors appointed an external law firm to investigate reports concerning his relationship with a businesswoman and possible foreign intelligence links. Reuters could not independently establish that she worked for the Chinese government. For more details on the investigation and its potential implications, read our analysis of Nvidia's Jensen Huang Faces Investigation: What Happens Next?. Huang's resignation as CEO took effect on 11 November and was announced the following day, with CFO Colette Kress named interim CEO. Nvidia did not disclose a reason for his departure.
For investors, the focus now shifts from the viral theory to more tangible factors: Nvidia's earnings outlook, AI infrastructure demand, valuation, and leadership transition. These fundamentals also matter to GCC investors holding Nvidia through regional ETFs.
Why Nvidia Stock Has Fallen 32% Despite Strong Earnings Growth
The slide began before the CEO news. Nvidia fell 9.3% on 5 November amid a broader semiconductor selloff, as investors reacted to weakness across semiconductor stocks, Qualcomm's disappointing sales outlook and concerns about the pace of AI infrastructure investment. The stock dropped another 4.3% on 12 November, when the CEO transition was announced, and lost approximately 12.75% over the week to 13 November.
Nvidia Stock Price Decline: Shares Fall 31.9% From October 2026 Record
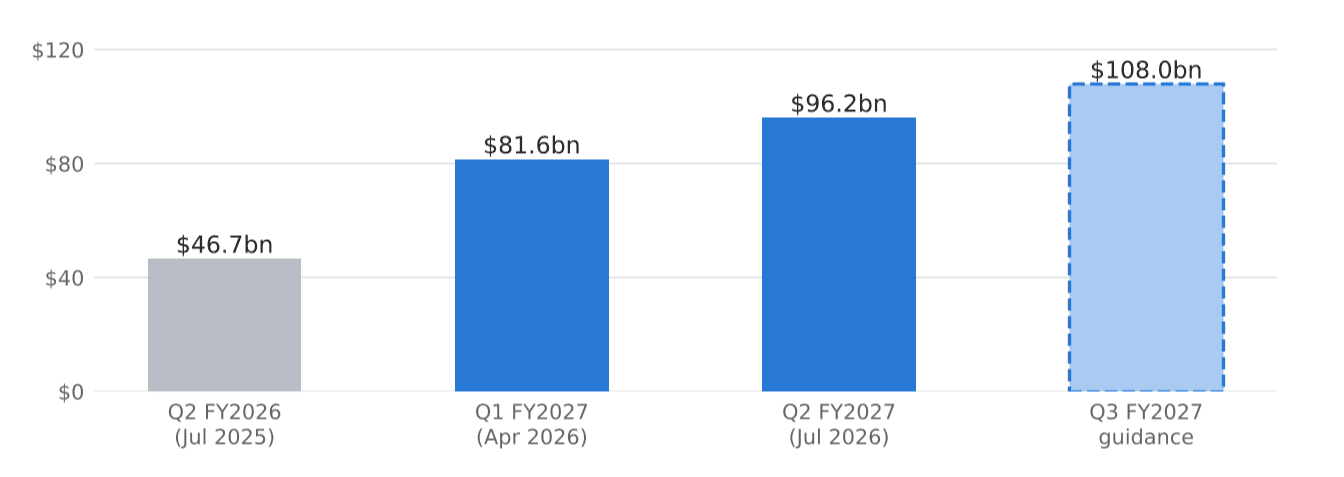
The business is still growing. Revenue for the second quarter of fiscal 2027, ended 26 July, reached $96.2 billion, up 106% year on year, while Data Center revenue was $89.0 billion, up 117%. Nvidia guided for third-quarter fiscal 2027 revenue of $108 billion, plus or minus 2%, with GAAP and non-GAAP gross margins of 74%, plus or minus 50 basis points. The guidance assumes no Data Center compute revenue from China. Third-quarter results are scheduled for 17 November after the US market close.
Nvidia Quarterly Revenue Growth: Q2 FY2027 Results and Q3 Forecast
Based on trailing EPS of $7.91, Nvidia trades at approximately 21 times trailing earnings. The fiscal 2028 consensus EPS estimate of approximately $15.8 implies a forward P/E of around 10 times. Forward valuation is based on analyst consensus EPS estimates for fiscal 2028, which are not guaranteed. A hypothetical 40% reduction in fiscal 2028 EPS would lower the estimate to approximately $9.48, lifting the implied P/E to around 17 times. That scenario is illustrative, not an analyst forecast, and trailing and forward EPS figures should be compared on a consistent accounting basis.
Nvidia Stock Valuation: Trailing and Forward P/E Ratios for FY2028
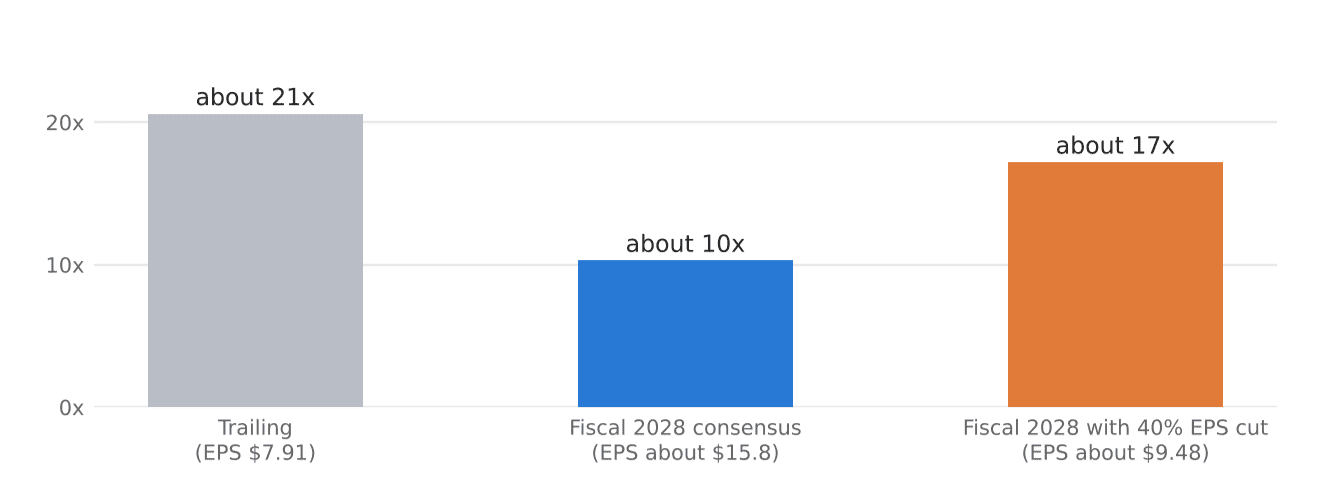
Nvidia P/E at the 13 Nov close of $162.85. Fiscal 2028 EPS is a consensus estimate; the 40% cut is a hypothetical scenario.
Four ETFs Giving GCC Investors Exposure to Nvidia
Note: Nvidia portfolio weights are based on the latest cited holdings disclosures. Albilad's 31.0% allocation is from its Q2 2026 factsheet; Lunate, GQGU and AGIX figures are as of 13 November 2026. The different reporting dates mean these weights are not directly comparable.
Albilad's Q2 2026 factsheet reported a 31.0% allocation to Nvidia. The fund tracks the MSCI USA TECH 125 Islamic M Series Index and provides exposure to US technology companies. Its reported Nvidia weight reflects the Q2 reporting period and may differ from subsequent portfolio holdings.
Lunate tracks 30 US mega-cap companies. Its holdings as of 13 November 2026 show Apple at 15.51%, Nvidia at 11.76%, Microsoft at 11.59%, Amazon at 7.81%, and Alphabet at 5.16%. Information Technology accounts for 54.40% of the portfolio. The fund reports an AUM of USD 7.32 million and a total expense ratio of 0.45%. Its one-year total return was 8.91% as of 11 November 2026, with performance calculated in the fund's base currency, net of fees and including reinvested distributions.
GQGU is an actively managed fund that currently trades on NYSE Arca. Nukoud previously reported that the fund's ADX cross-listing was expected on 19 November 2026, following an initial offering period from 9 to 13 November. Until then, GCC investors need a broker that offers access to US-listed ETFs. Its Nvidia allocation was approximately 6.88%on 13 November, according to available holdings data, and the fund held about $473 million in assets as of 5 November. Morningstar has also highlighted the fund's rapid shift towards technology stocks, with the sector reaching approximately 58% of its portfolio.
AGIX tracks the Solactive Worldline Artificial General Intelligence Index and can invest in private AI companies. Its portfolio extends beyond chipmakers to companies involved in AI infrastructure and applications. On 13 November, Meta (5.25%), Microsoft (4.22%), Alphabet (4.05%) and Amazon (3.27%) ranked ahead of Nvidia.
The three funds with November 13 holdings data show different levels of direct Nvidia exposure. Lunate had the highest allocation at 11.76%, followed by GQGU at 6.88% and AGIX at 2.96%. Albilad's Q2 2026 factsheet separately reported a 31.0% allocation.
A further 10% decline in Nvidia, assuming unchanged portfolio weights and no offsetting movements elsewhere, would imply a direct impact of approximately 1.18 percentage points on Lunate, 0.69 percentage points on GQGU and 0.30 percentage points on AGIX. These are illustrative estimates, not forecasts of the funds' actual returns. A comparable current estimate for Albilad is not included because its cited Nvidia allocation is from Q2 2026.
Nvidia Earnings, AI Spending and Leadership: What Investors Should Watch
On 17 November, investors will watch revenue against Nvidia's $108 billion guidance, gross margin against the 74% forecast, and management's commentary on AI infrastructure demand, hyperscaler spending and the product transition. The CEO succession process and board investigation add another layer of uncertainty.
Albilad and Lunate have relatively small AUM of approximately $6 million to $7 million each at the cited reporting dates. Investors should consider trading volume, bid-ask spreads, and available liquidity before placing orders. All four funds have substantial US exposure, although AGIX also invests across the global AI value chain. The UAE dirham and Saudi riyal are pegged to the US dollar, which limits exchange-rate fluctuations against the dollar but does not eliminate currency risk for investors whose home currency is different.
The 'Affair Rally' does not offer a reliable signal for predicting stock returns. For investors considering the Nvidia correction, the more relevant questions are whether the company's earnings growth can support its valuation, how its leadership transition affects investor confidence, and how much exposure they want through an ETF.