


Five ETFs can make a portfolio look diversified. They can also hide how much risk is moving in the same direction. For a GCC investor, building a long-term portfolio often means combining UAE equities for local exposure, GCC dividend ETFs for income, US value stocks for international diversification, gold for an alternative source of returns, and thematic ETFs focused on areas such as artificial intelligence or quantum computing.
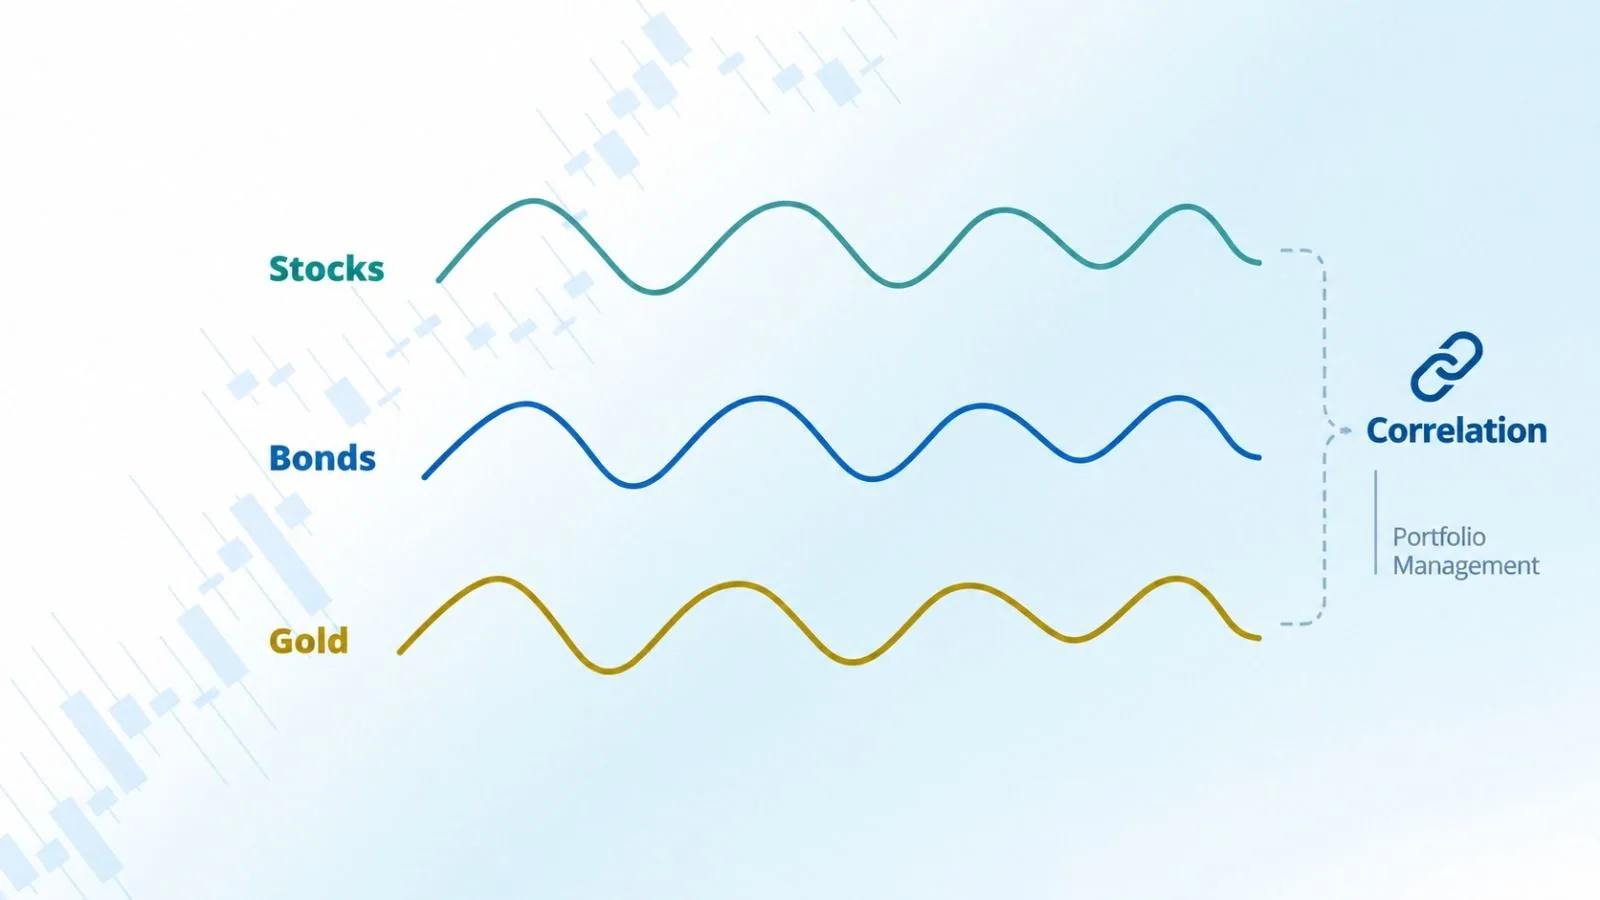
On paper, these investments cover different markets, asset classes, and themes. But what matters is not only what an investor owns; it is how those investments behave together. Two ETFs can look completely different on the surface yet respond to the same market forces and move in the same direction. Others may behave differently when markets become volatile, potentially providing greater diversification.
Understanding these relationships can give GCC investors another way to look at portfolio construction and long-term risk. That is where correlation comes in.
Correlation and Portfolio Diversification for GCC Investors
Correlation is a statistical measure of how two assets' returns have moved relative to each other over a particular period.
The correlation coefficient ranges from -1 to +1. A value close to +1 means the two assets have tended to move in the same direction. A value close to -1 means they have tended to move in opposite directions. A value around 0 means there has been little consistent linear relationship. But the number is more useful when you put it into the context of an actual portfolio. Consider the correlation matrix below, which compares a selection of GCC and global ETFs across equities, fixed income, gold and technology themes. The colour-coded grid provides a quick way to see which ETFs have historically moved more closely together and which have shown weaker or negative relationships.
How to Read a Correlation Matrix: Blue, Green and Red
The colours provide a quick way to interpret the relationships in the grid. Blue indicates negative correlation, green indicates low-to-moderate positive correlation, and red indicates high positive correlation. Blue pairs have shown a negative relationship over the period measured, meaning their returns have tended to move in different directions to some degree. Green pairs have tended to move in the same direction to some degree, but not particularly strongly. Red pairs have shown a stronger tendency to move together.
For GCC investors, the key is not to treat one colour as automatically good or bad. Instead, the grid helps show where a portfolio may have overlapping exposures and where different holdings have historically behaved differently.
What Does the Correlation Matrix Reveal About GCC ETFs?
The matrix provides a useful illustration of why investors should look beyond the names of their ETFs. The strongest positive relationship in the matrix is between AGIX (KraneShares AI) and QUANTM (Boreas Solactive Quantum Computing UCITS ETF), with a correlation of 0.615. Both are technology-oriented thematic strategies. An investor holding both might reasonably think they are gaining exposure to two different themes. The correlation matrix adds another layer to that decision: historically, the two return series have moved together relatively strongly. That does not mean they are identical investments. It simply means their historical return patterns have had a meaningful positive relationship.
Now compare that with ALINMETF (Alinma Sukuk) and UAEA (Lunate UAE), which show a correlation of -0.130 in the matrix. That is a much weaker relationship and is slightly negative. In portfolio terms, such a relationship can potentially provide more diversification than combining two assets that tend to move closely together. The same idea appears elsewhere in the matrix. BONDAE (Lunate UAE Bond) and USVALUE (Lunate US Value) correlate at -0.161, while GCCDIV (Lunate GCC DIV) and AIPOWR (Boreas S&P AI Data, Power & Infrastructure UCITS ETF) show -0.111.
These numbers are not predictions. They simply show that, over the period represented by the dataset, these pairs did not consistently move in the same direction. For a GCC investor, that distinction matters. A portfolio combining regional equities, fixed income, commodities, and international assets may have a different risk profile from one made up primarily of funds exposed to the same growth or technology drivers.
ETF Overlap and Portfolio Risk
Suppose an investor owns five ETFs.
That sounds diversified. But if all five are heavily exposed to the same economic factor, sector, or market theme, their returns may behave similarly when conditions change.
Now imagine another portfolio with five ETFs whose return patterns are less closely related. The number of ETFs is the same. The diversification may not be. This is why correlation sits at the heart of portfolio diversification. When assets are less than perfectly positively correlated, combining them can reduce portfolio volatility relative to holding the assets separately, all else being equal.
For GCC investors, this can be particularly relevant when combining local and international equities, bonds or Sukuk, commodities such as gold, and thematic or technology exposures. The objective is not necessarily to find assets with negative correlation everywhere. A portfolio made entirely of negatively correlated assets is neither realistic nor automatically desirable. Instead, investors can use correlation to understand where their portfolio may be moving together and where it may be getting some diversification.
Gold and Other Diversifying Assets in a GCC ETF Portfolio
A UAE investor might hold a UAE equity ETF, a GCC dividend ETF and a global technology ETF. Those funds may have different names and investment mandates, but their underlying economic exposures can overlap. For example, the matrix shows a correlation of 0.310 between UAEA and AIPOWR, and 0.420 between QUANTM and AIPOWR. Again, these relationships do not mean that the ETFs will necessarily move together in the future. They simply show how their historical return patterns relate in the dataset.
Gold is another useful example for GCC portfolios.
It is often discussed as a diversification asset, but investors should not assume that gold will always rise when equities fall. The relationship between gold and equities can change with the market environment. During some periods, both can rise as investors seek exposure to different sources of return. During periods of stress, their behaviour can diverge. The matrix reflects this more nuanced picture. ALBIGOLD (Albilad Gold) has relatively low positive correlations with several assets in the dataset. Its correlation with KWEB (KraneShares China) is 0.090, with AGIX it is 0.120, and with USVALUE it is 0.244.
That does not establish gold as a guaranteed hedge. Instead, it illustrates why an asset can play a different role in a portfolio without necessarily having a permanently negative relationship with equities.
Why Correlation Changes Over Time
There is one important catch: correlation is not permanent. The relationship between two assets can change as interest rates, inflation, economic growth, commodity prices, currencies, and investor sentiment change. This is particularly important for GCC investors because regional markets are influenced by both domestic factors and global markets. A period of rising oil prices, for example, can produce a very different market environment from one characterised by falling energy prices and tighter global financial conditions.
The correlation an investor sees today therefore should not be treated as a guarantee of how two assets will behave five years from now. The lookback period also matters. A 90-day correlation can tell a different story from a five-year correlation because the underlying market environment may have changed.
Can Low Correlation Reduce Portfolio Risk?
This is one of the easiest mistakes to make. An asset can be extremely volatile while still having a low correlation with another asset. Correlation measures how assets move relative to each other. It does not measure how risky an asset is on its own. Portfolio risk depends on several factors, including the volatility of each holding, its portfolio weight, and how its returns interact with the returns of the other holdings. That means an investor should not simply search for the lowest correlation numbers and build a portfolio around them.
Why Correlation Does Not Tell You What Causes an Asset to Move
Correlation also does not tell you why two assets moved together. Two ETFs could have a positive correlation because they are both responding to interest rates, economic growth, technology investment, currency movements, or investor sentiment. The correlation shows the relationship in the data. It does not establish a cause-and-effect relationship. That distinction becomes particularly important when comparing thematic ETFs. Two funds may invest in different themes but still respond to similar market forces.
Limitations of Correlation in ETF Investing
Correlation works best as one part of a broader portfolio review. It measures a linear relationship, so it may not fully capture more complex or nonlinear relationships. It can also be influenced by outliers, and the result can change significantly depending on the sample size and lookback period.
For investors, this means a correlation figure should be treated as context, not a permanent characteristic of an ETF.
How Should GCC Investors Use Correlation When Building an ETF Portfolio?
Correlation can help GCC investors look beyond simply counting the number of ETFs they own. The first step is to understand what each holding actually represents—the markets, sectors, countries, and economic factors driving its returns. Investors can then look at which holdings have historically moved together using a correlation matrix, helping identify areas where the portfolio may have overlapping exposures. Finally, each ETF should have a clear role within the portfolio: an equity ETF may provide growth exposure, a bond or Sukuk ETF may add fixed-income exposure, gold may provide commodity exposure, while a thematic ETF may offer targeted exposure to a specific trend. The goal is not to eliminate correlation, but to understand it and how it can affect portfolio risk over time.
The Bottom Line
For GCC investors, diversification is about more than owning several ETFs. Understanding how those investments move together can help reveal hidden concentration and potential diversification benefits.
Correlation is not fixed, but it can be a useful tool for assessing portfolio risk and making more informed long-term investment decisions.