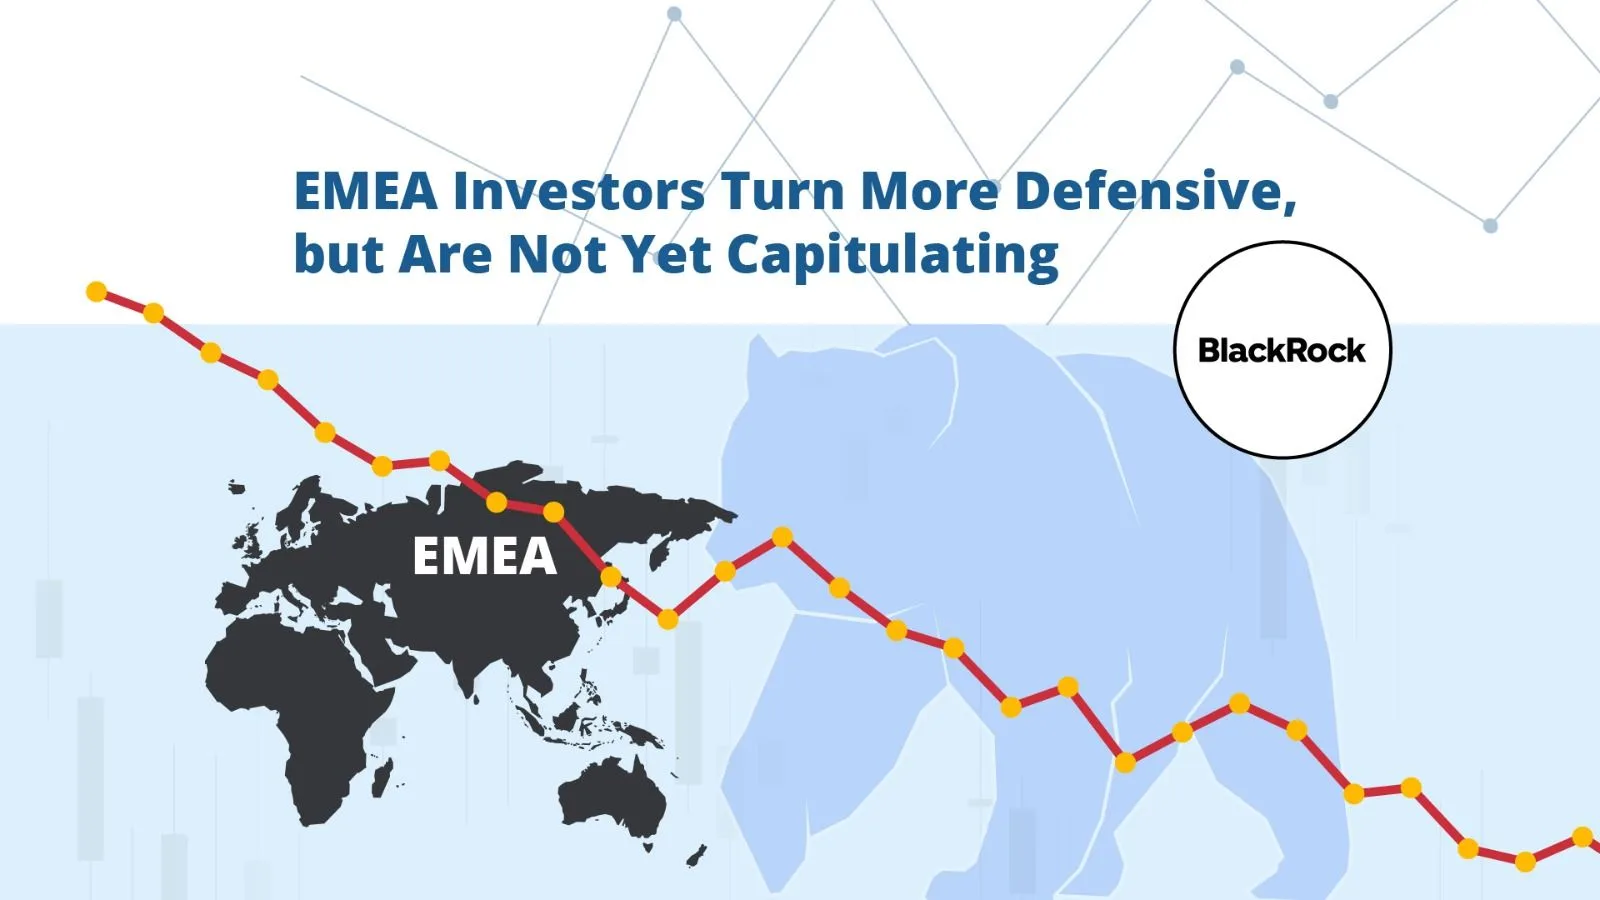
The April 7 sentiment recovery is particularly significant because it demonstrates rapid market repricing on geopolitical de-escalation. In just five weeks, sentiment swung a full 25 points from -23 to +2, matching the speed and magnitude of the collapse. Bearish respondents halved from 40% to 17%, while bullish respondents climbed back to 19%.
Critically, this recovery occurred without capitulation: institutional clients remained positioned in European and emerging market equities throughout the sell-off, allowing for a cleaner recovery bounce when risk sentiment turned. The narrow spread between allocation preferences (down from 67% on 3 February to 24% on 7 April) suggests conviction remains selective, but the directional signal is unmistakable; fear is giving way to opportunism.
The moment sentiment broke
The inflection point maps almost precisely onto the Iran conflict. US-Israel strikes from 28 February triggered immediate risk-asset repricing. Eurozone inflation jumped to 2.5% in March, the highest in close to a year, as energy prices surged on Middle East supply fears, pushing market expectations for an ECB rate rise sharply higher. Hedge funds were caught in the crossfire: the Bank of England noted that gilt traders suffered an "abrupt repricing" as trend-following funds, which had built up positions betting on market calm, were particularly hard hit.
Negative sentiment, resilient positioning
What makes the BlackRock survey data notable is that it captures anxiety without full capitulation. On 5 March, at the height of early Iran war market turbulence, BlackRock noted that institutional EMEA clients were still holding their positions in European and emerging market equities, even as weekly sentiment readings turned sharply negative. The survey tracks self-described risk views, not actual portfolio positioning, making it a forward-looking gauge rather than evidence of active selling. BlackRock's house view remains: stay invested, diversify diversifiers, and tactically lean into market dislocations.
Where investors are adding exposure
The most recent survey points to selective repositioning rather than broad-based de-risking. The spread between the most popular areas to increase or reduce allocations narrowed sharply from 67% on 3 February to just 24% in the week ending 7 April, highlighting the difficulty of making high-conviction calls in this environment.
Emerging market equities
Back at the top despite energy sensitivity. EMEA-listed ETP flows: $19.6B YTD, more than half the full-year 2025 total of $37.1B.
Gold
The sell-off created an entry point despite inflation headwinds. EMEA gold ETP outflows eased to $0.2bn in March vs $1.7bn in February.
Liquid alts / hedge funds
First time in the top three. Investors seeking strategies with potential for uncorrelated returns and market dislocation exposure.
US equities
Appetite is now flat at 0%, a vast improvement from −17% in early March. $0.7B in EMEA ETP outflows in March may be stabilising.
Where the flows are pointing:
ETP data reinforces EM conviction. EMEA-listed ETP flow data broadly reinforces the survey's positioning signals. Investors have added $19.6 billion to emerging-market equity ETPs year-to-date in 2026, more than half of the $37.1 billion added across all EMEA ETP categories in the full year 2025. The pace of inflows held even through the worst weeks of the conflict, suggesting that the EM overweight in the BlackRock survey reflects genuine portfolio commitment, not just stated intention. By contrast, US equity ETPs saw $0.7 billion in outflows in March, while gold ETP selling eased sharply from $1.7 billion in February to just $0.2 billion as the conflict repositioned gold as a tactical hedge rather than an asset to trim.
Within the EM bucket, the conflict has sharpened the distinction between oil importers and exporters. The three markets where the dislocation between sentiment-driven price declines and underlying fundamentals appears most pronounced and where EMEA ETP flow data points to residual demand are the UAE, Saudi Arabia, and Turkey.
Contrarian opportunity: Are GCC equities now trading at a discount?
The Iran war inflicted a severe but arguably indiscriminate sell-off across GCC equity markets. As the provisional ceasefire takes hold and the Strait of Hormuz partially reopens, a contrarian case is forming, one rooted in the gap between sentiment-driven price declines and the underlying fundamentals of Gulf markets. The core dislocation: GCC sovereigns, particularly Saudi Arabia, are net beneficiaries of elevated oil prices, yet markets sold off primarily on proximity risk. The UAE, meanwhile, bore the heaviest losses from conflict disruption, making it the largest potential recovery trade.
Three contrarian plays emerging from the data
UAE equities are the largest dislocation, with the most recovery upside
The DFM and ADX shed a combined ~$120 billion in market capitalisation from the outbreak of conflict to trough a sell-off amplified by the UAE's exposure as a regional travel and financial hub rather than by deterioration in underlying earnings capacity. On the ceasefire day alone, the DFM surged 6.9%, with real estate up 11.6%, Emirates NBD +10.6%, and Emaar Properties up approximately 13%. The speed and composition of that recovery signal, where pent-up demand had been coiling. For investors who believe the ceasefire holds, UAE equities represent the largest single-market recovery trade in the EMEA EM universe.
Saudi Arabia net oil beneficiary with a pre-existing value case
TASI had already fallen 13% in FY25 before the war began, approaching the lower end of its historical valuation range. Saudi Arabia's ability to export oil via the Red Sea, bypassing the Strait of Hormuz entirely, means it is a net beneficiary of elevated energy prices, not a victim of the conflict. Saudi institutions recognised this: they were net buyers of $1.9 billion of Riyadh-listed stocks in March, reversing 14 months of sustained selling.
Non-oil GDP growth of 4.8% provides an earnings floor beyond energy, and the Vision 2030 project spending underpins non-cyclical sectors. The risk is that petrochemicals remain structurally weak, and foreign investors were net sellers in March, but the domestic bid is real and appears durable.
Turkey's geopolitical proximity discount, but structural recovery is intact
Turkey's BIST 100 fell from a record high of 14,339 in mid-February to 12,793 by 9 Mar, a drawdown of approximately 10.8% as the lira came under pressure and the central bank was forced to pause its rate-cutting cycle and intervene with more than $8 billion in FX reserves to defend the currency. That disruption, however, is not a structural deterioration. Turkey's inflation trajectory remains broadly intact, easing to 30.87% in March from a peak of 65% in May 2024, and the central bank's policy credibility has been tested but not broken.
The ceasefire rally on 8 April was +4.3%, with the banking index surging 8.8% and airline stocks up more than 6%, all reflecting the market's view that the war discount was situational, not fundamental. Defence names such as Aselsan, which are up approximately 300% year-on-year on NATO spending tailwinds, provide an additional structural layer to the bull case. The key risk remains political: the İmamoğlu trial has introduced a persistent governance discount that limits how far foreign investors will re-engage, and the rate-cutting cycle is now frozen until inflation data convincingly resumes its downward path.
How to access these markets
Across all three markets, the common thread is the same: sentiment-driven drawdowns that outpaced any deterioration in fundamentals, a ceasefire that has already begun to reprice the discount, and ETP flow data showing that EMEA investors had not fully exited. The question is whether the diplomatic process holds long enough for that thesis to play out.