
Gold fell to its lowest level in more than seven weeks on September 28 as rising U.S. Treasury yields, a firmer dollar, higher oil prices and renewed expectations for Federal Reserve rate hikes weighed on the metal.
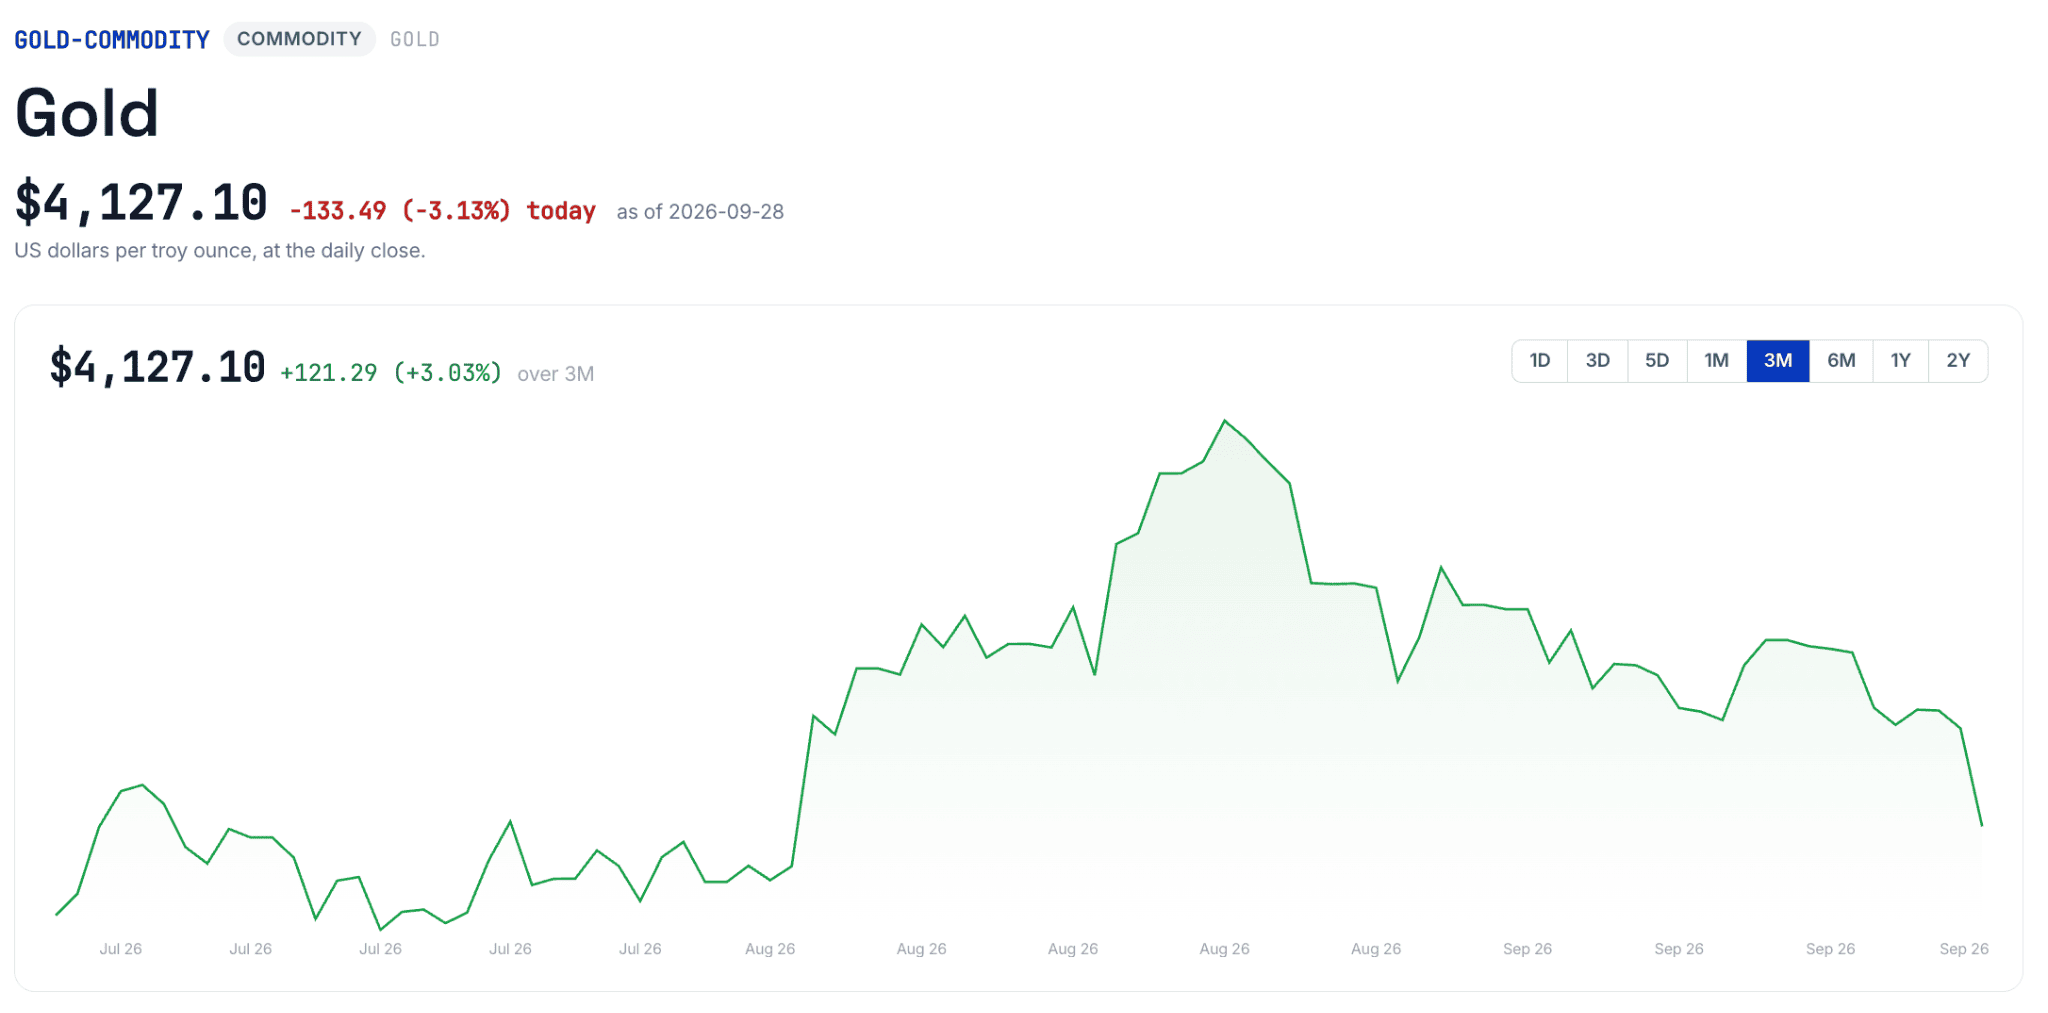
Spot gold dropped as much as 4% to $4,110.55 an ounce on Monday before settling at $4,136.81, while U.S. gold futures closed 3.5% lower at $4,168.40. Gold recovered modestly on September 29 to around $4,140, but remained close to Monday’s low.
The move extends a weaker September for gold after a strong first half of the year. The World Gold Council said the LBMA Gold Price PM fell 2% in the week to September 25 to $4,261 an ounce, taking its 2026 return to -2.4% at that point. The same report linked the decline to strong U.S. economic data, hawkish Federal Reserve commentary, rising bond yields and dollar strength.
Higher Real Yields Are the Main Pressure Point
Gold does not generate income, so rising real yields increase the opportunity cost of holding it.
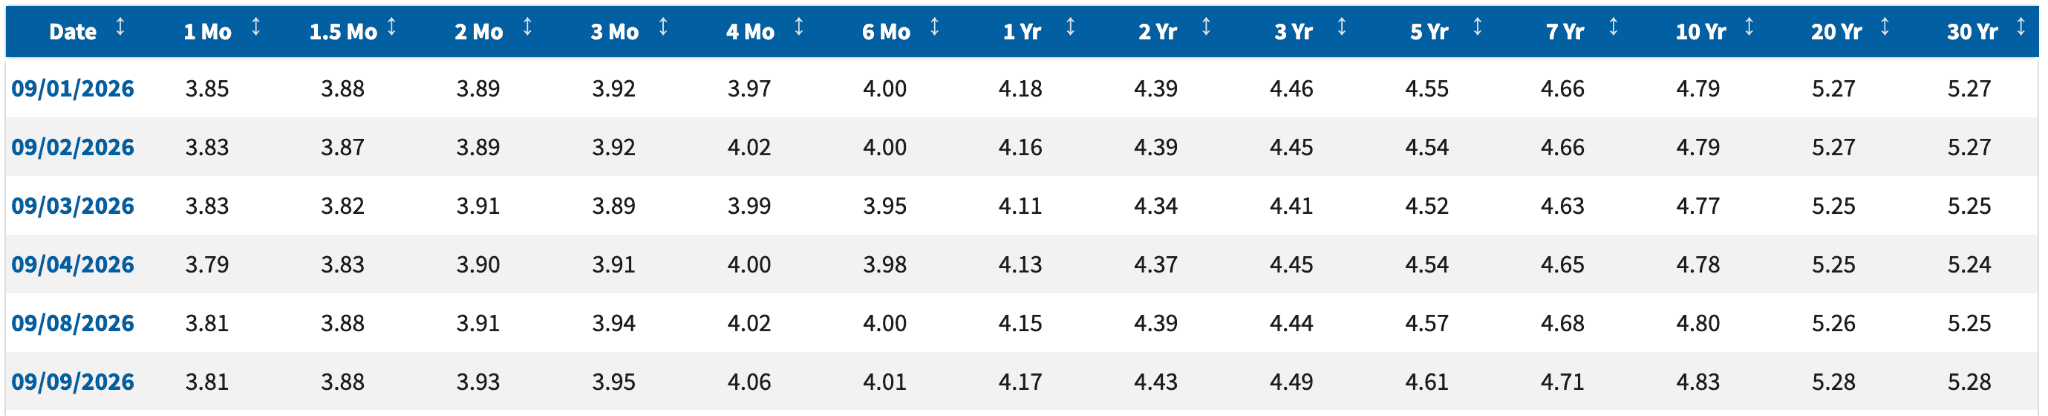
Source: U.S. Department of the Treasury, Daily Treasury Par Yield Curve Rates.
The U.S. 10-year Treasury yield had reached 5.16% by September 25, compared with a 2026 low of 3.92%.
Ten-year real yields had also climbed above 2.7% and were approaching the 2.92% to 3.00% area identified by the Council as the next major resistance zone.
Reuters reported on September 29 that the nominal 10-year Treasury yield was approaching 5.27%, its highest level in 19 years.
Sources: Reuters, World Gold Council, Bloomberg.
Gold ETFs Are Feeling the Move
The pressure has flowed directly into physically backed gold ETFs.
Nukoud’s data show GLD, IAU and SGOL each fell 1.9% over the five trading days to September 25 and 6.9% over one month. The London-listed iShares Physical Gold ETC, IGLN, fell 1.7% over five days and 6.8% over one month.
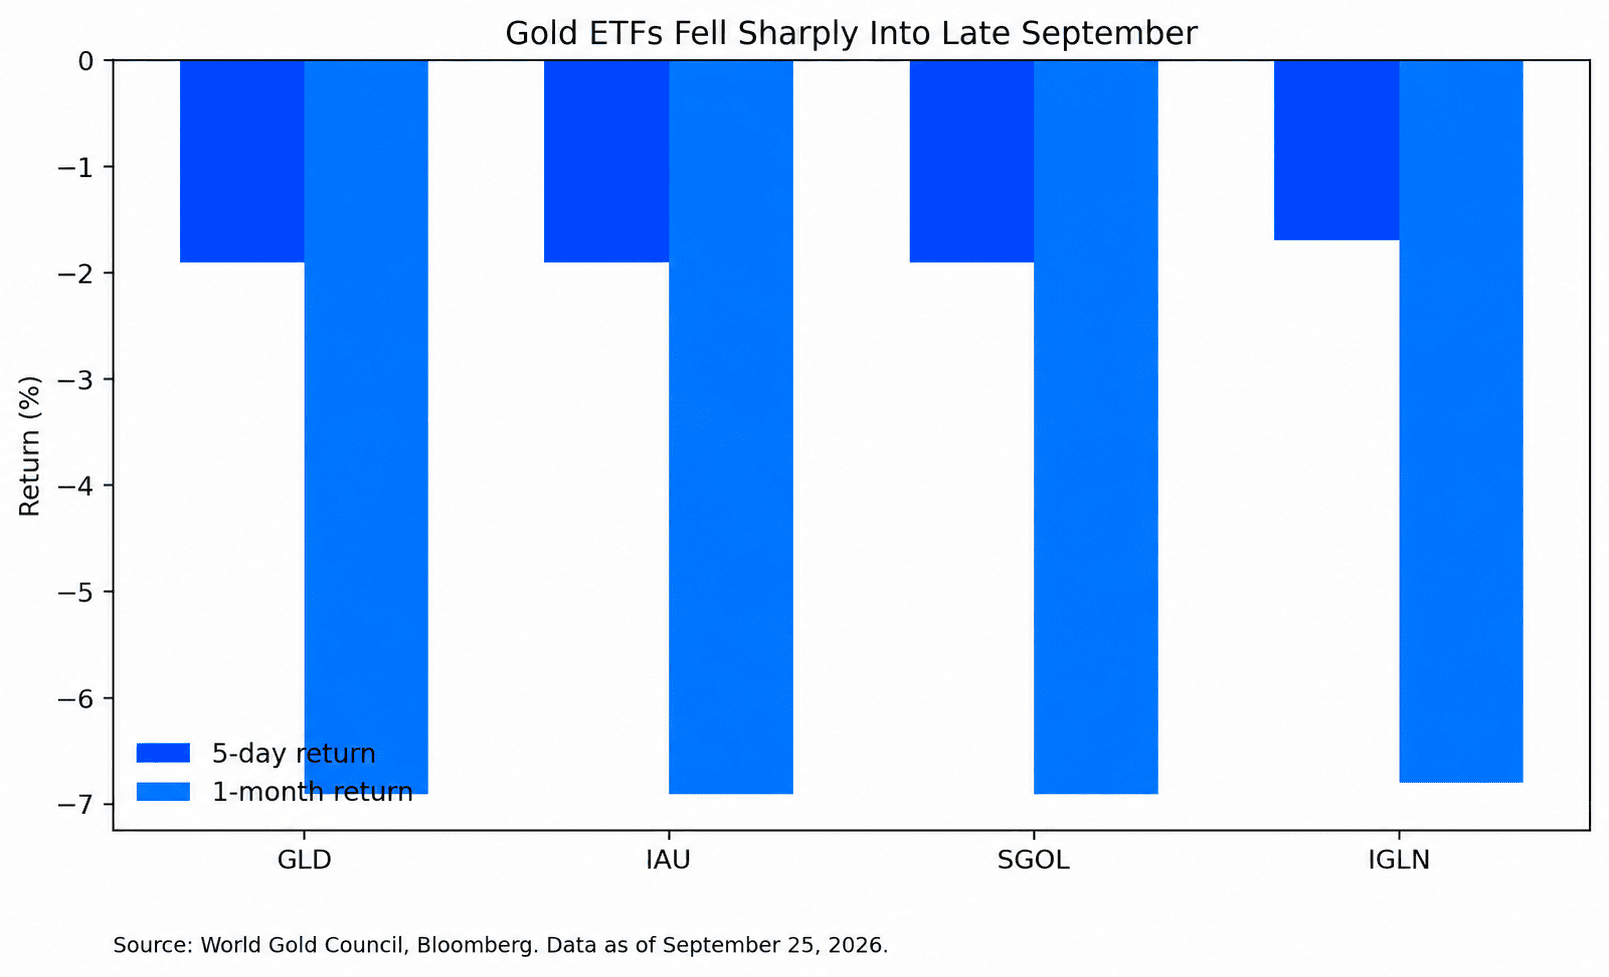
The first weekly global gold ETF outflow since mid-July in the week to September 25, while COMEX money managers cut net long exposure.
That comes after a stronger July, when global gold ETFs attracted $3 billion of net inflows, lifting global holdings to 4,068 tonnes and assets to $530 billion.
The GCC Has Its Own Gold ETF Route
The Albilad Gold ETF (9405) on the Saudi Exchange provides direct exposure to physical gold through a Saudi-listed, Shariah-compliant ETF. Albilad Capital’s latest published basket shows the fund holding 470 kilograms of gold, equal to 15,040 ounces, with bars sourced from approved refiners including SAM Precious Metal Refinery and Emirates in Dubai.
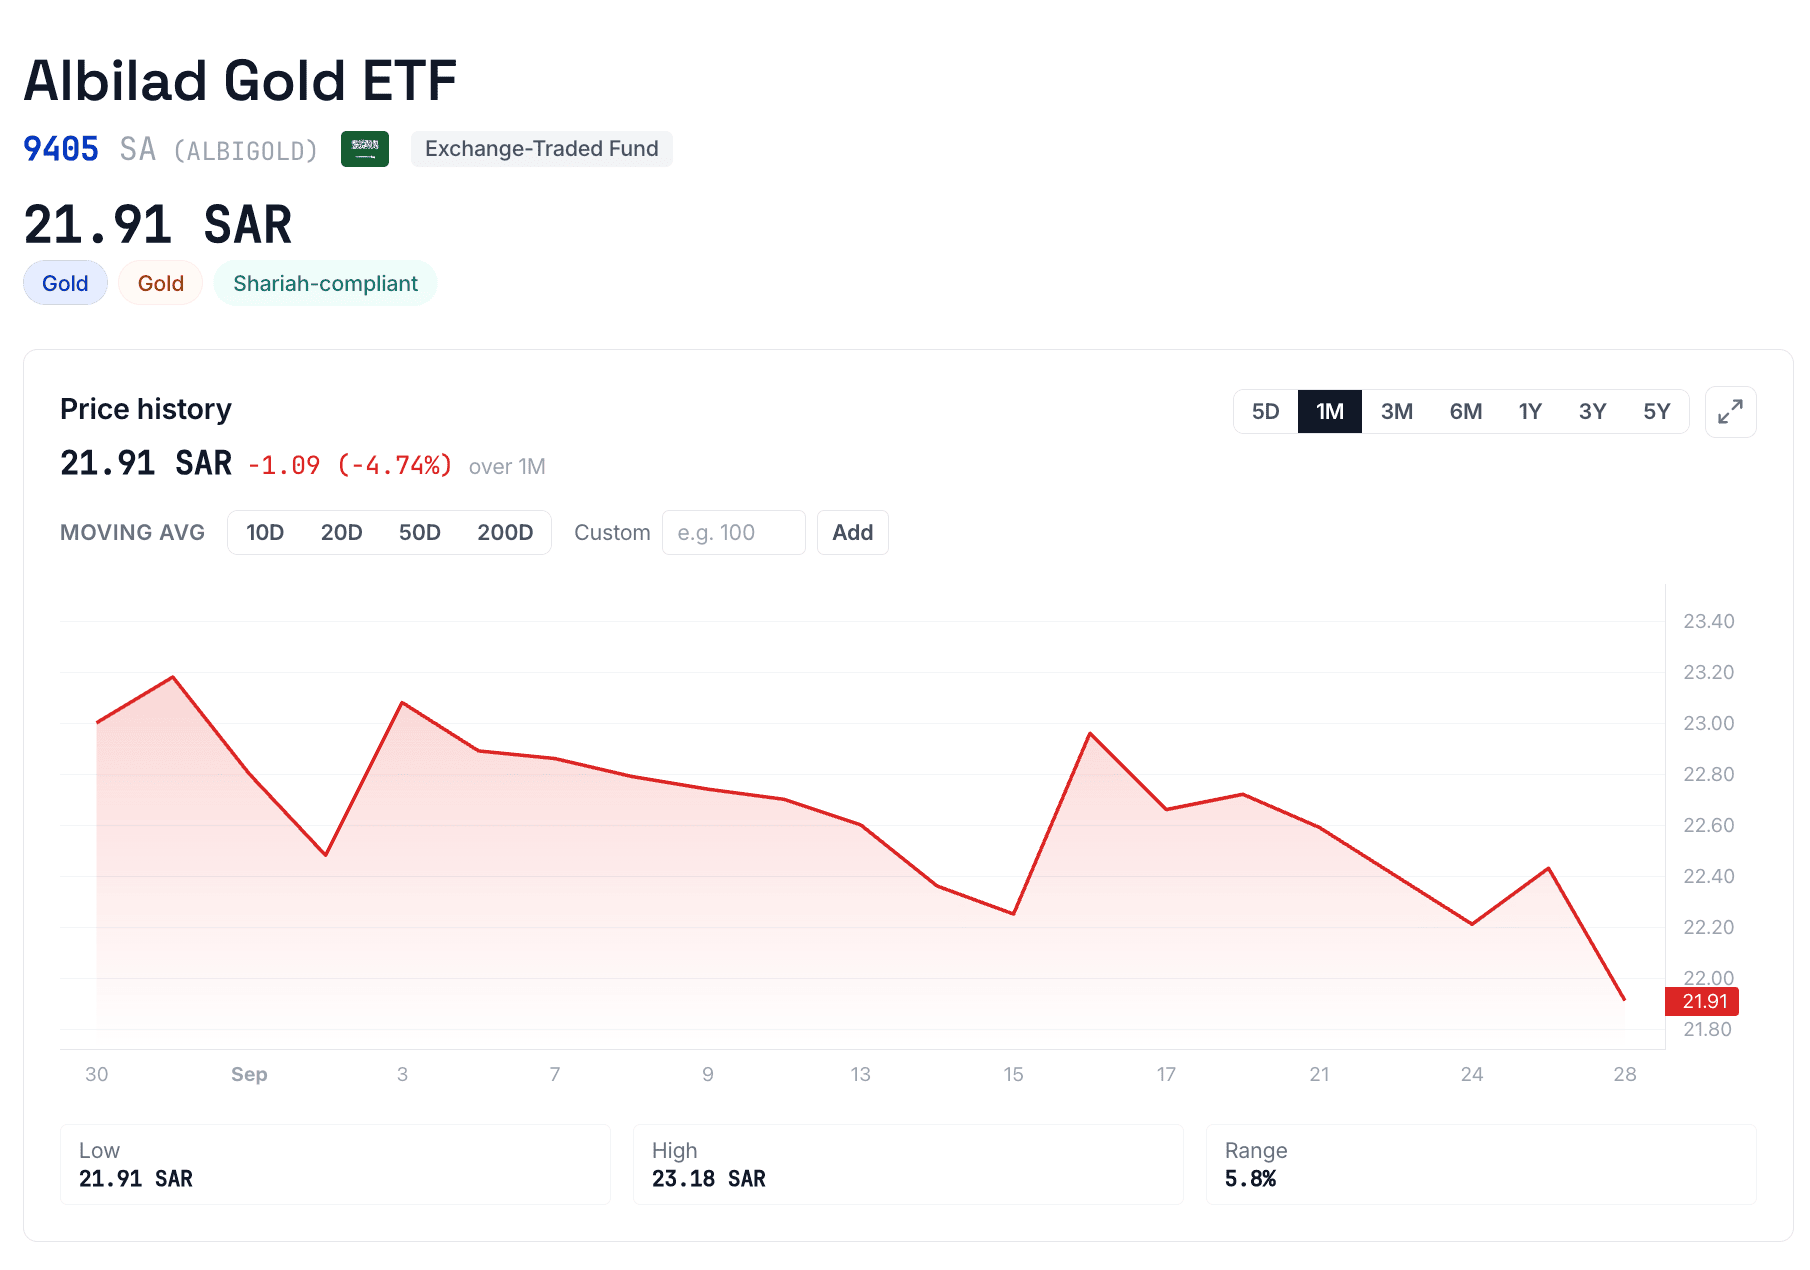
The fund had 10.8 million units outstanding and SAR245.3 million in assets based on the Saudi Exchange NAV snapshot dated September 20. Its NAV stood at SAR22.71 per unit.
That compares with SAR226.2 million in net assets at June 30, when the fund reported a first-half loss of SAR35.7 million and a period return of -6.81%.
Trading activity has been meaningful for a specialist commodity ETF. Saudi Exchange data show that 9405 traded SAR38.4 million in August across 1.67 million units, making it one of the more actively traded ETFs on Tadawul that month. AUM stood at SAR257.9 million at the end of August.
What Comes Next
Gold is now trading in a much less forgiving interest-rate environment. The move above 5% in long-term U.S. Treasury yields have raised the opportunity cost of holding an asset that pays no income, while a firmer dollar has added another source of pressure.
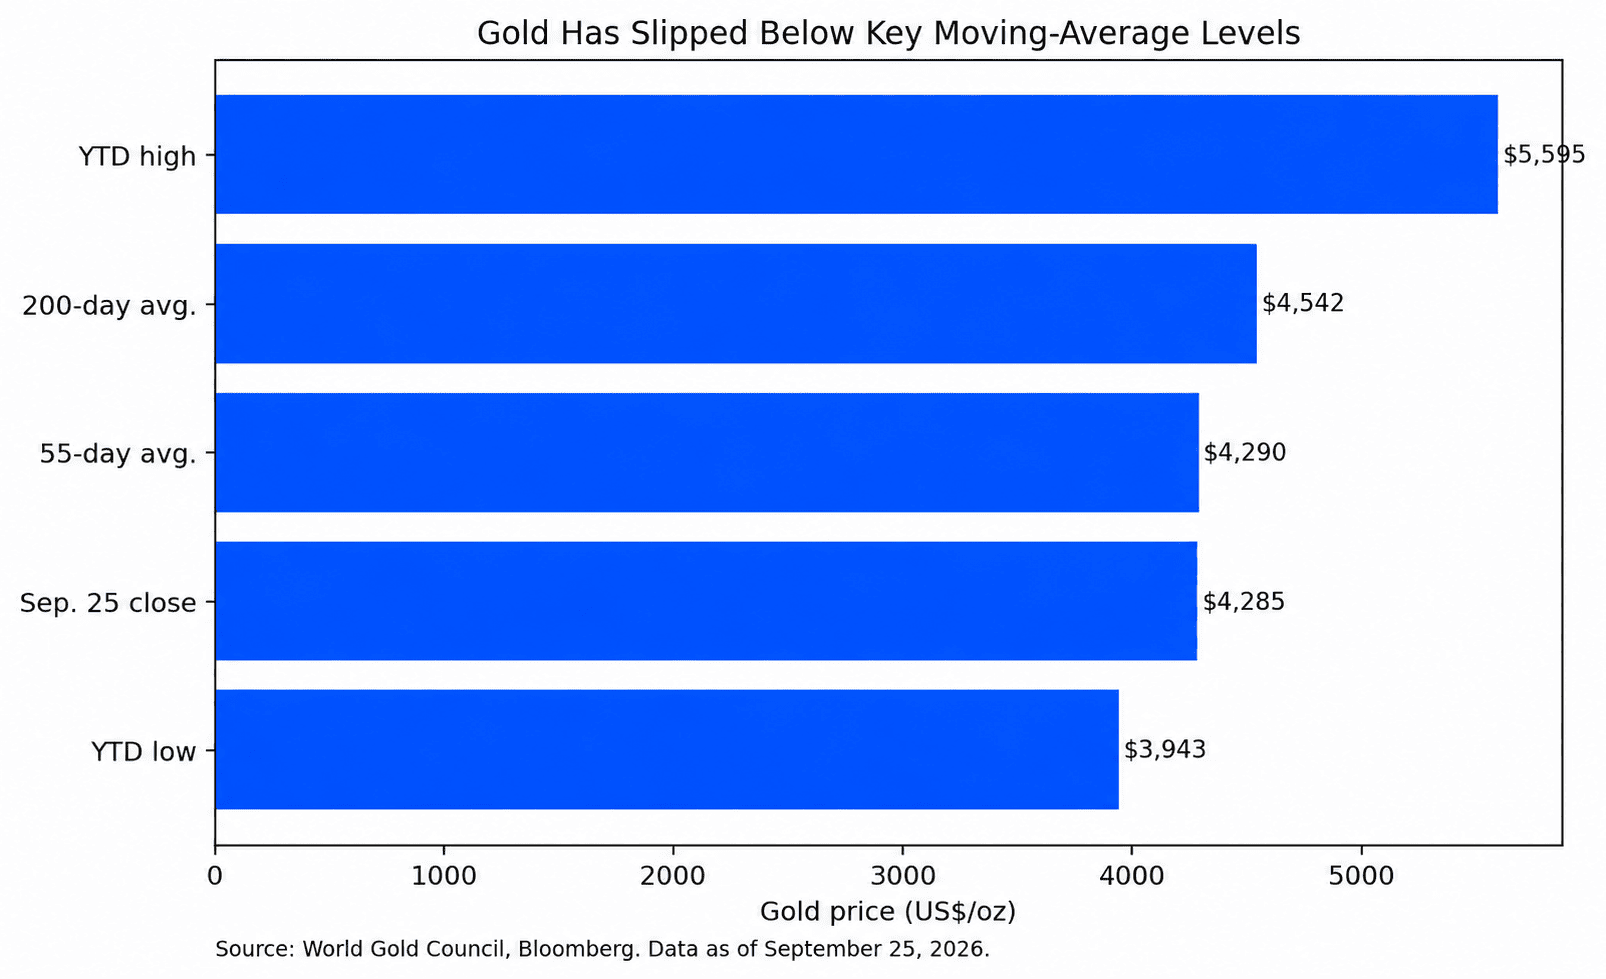
The next test is whether that macro pressure continues or begins to ease. Softer U.S. inflation or employment data could reduce expectations for further Fed tightening, while stronger inflation would keep real yields elevated and leave gold vulnerable to another leg lower.
Physical demand may provide some counterweight. China enters its Golden Week holiday from October 1 to 7, traditionally an important period for jewellery demand and dealer restocking. Recent price weakness could encourage some deferred buying if consumers become more comfortable at lower levels.
For ETF investors, the distinction is becoming sharper. Gold remains a portfolio diversifier and geopolitical hedge, but the hurdle rate has risen considerably when U.S. government bonds offer yields above 5%. The next move in gold ETFs will therefore depend less on the metal’s long-term narrative and more on what happens to real yields, the dollar and investor flows over the coming weeks.