Mutual funds have existed in India since 1964, and the industry has grown steadily since, with participation accelerating after May 2014. As of January 2025, India had over 1,500 mutual fund schemes and more than 22.9 crore investor accounts. From within this broader industry emerged a new structure: the Exchange-Traded Fund. An ETF is a basket of securities stocks, bonds, gold, or other assets that trades on a stock exchange throughout the day, just like an individual share. Most ETFs replicate an index such as the Nifty 50 or Sensex rather than actively picking stocks, combining index-based diversification with stock-like tradability.
Why ETFs Over Stock-Picking or Active Funds
Direct stock-picking is genuinely difficult to get right consistently, even for professionals, and ETFs sidestep a major risk of direct investing: fund-manager and stock-specific risk. The SPIVA 2024 year-end report makes this case with hard numbers on how often actively managed Indian funds have failed to beat their benchmarks:
For investors seeking benchmark exposure, these results highlight the appeal of index-tracking ETFs as an alternative to relying on active management.
India’s ETF Market in the Global Landscape
ETFs have become a major global investment vehicle, with global ETF assets reaching a record US$21.91 trillion across 16,605 ETFs as of April 2026, according to ETFGI. India’s ETF market is smaller by comparison but has expanded significantly, with US$119.8 billion in ETF assets across more than 300 products as of March 2026, according to HSBC. This highlights both the scale of the global ETF industry and the continued growth potential of India’s ETF market.
Source: HSBC (March 2026); ETFGI (April 2026).
The Indian ETF Journey and Growth
India's ETF market has evolved from a niche investment product into a significant part of the country's passive-investment ecosystem. The first ETF was launched in January 2002, followed by the first liquid ETF in 2003 and the first Gold ETF in 2007. A major catalyst came in 2013, when the government reduced Securities Transaction Tax on ETFs and permitted the Employees' Provident Fund Organisation (EPFO) to invest in them. EPFO began investing in ETFs in August 2015, helping accelerate institutional participation and market growth.
The market has expanded substantially since then. ETF AUM rose from ₹1.54 lakh crore (US$15.4 billion) in March 2020 to ₹8.39 lakh crore (US$83.9 billion) in March 2025, representing more than a fivefold increase. By March 2026, ETF AUM had reached approximately ₹11.45 lakh crore (US$119.8 billion) across more than 300 ETF products. Non-gold ETF AUM increased 14.8% year over year and 84.7% over three years, highlighting the continued acceleration of passive investing in India.
The expansion has also been accompanied by greater product diversity and investor participation. ETFs now span broad-market equities, sectors and themes, bonds, gold, silver and international markets, giving investors access to increasingly varied strategies through an exchange-traded structure. Retail investors account for around 25% of ETF AUM, highlighting the growing role of individual investors in India's ETF market.
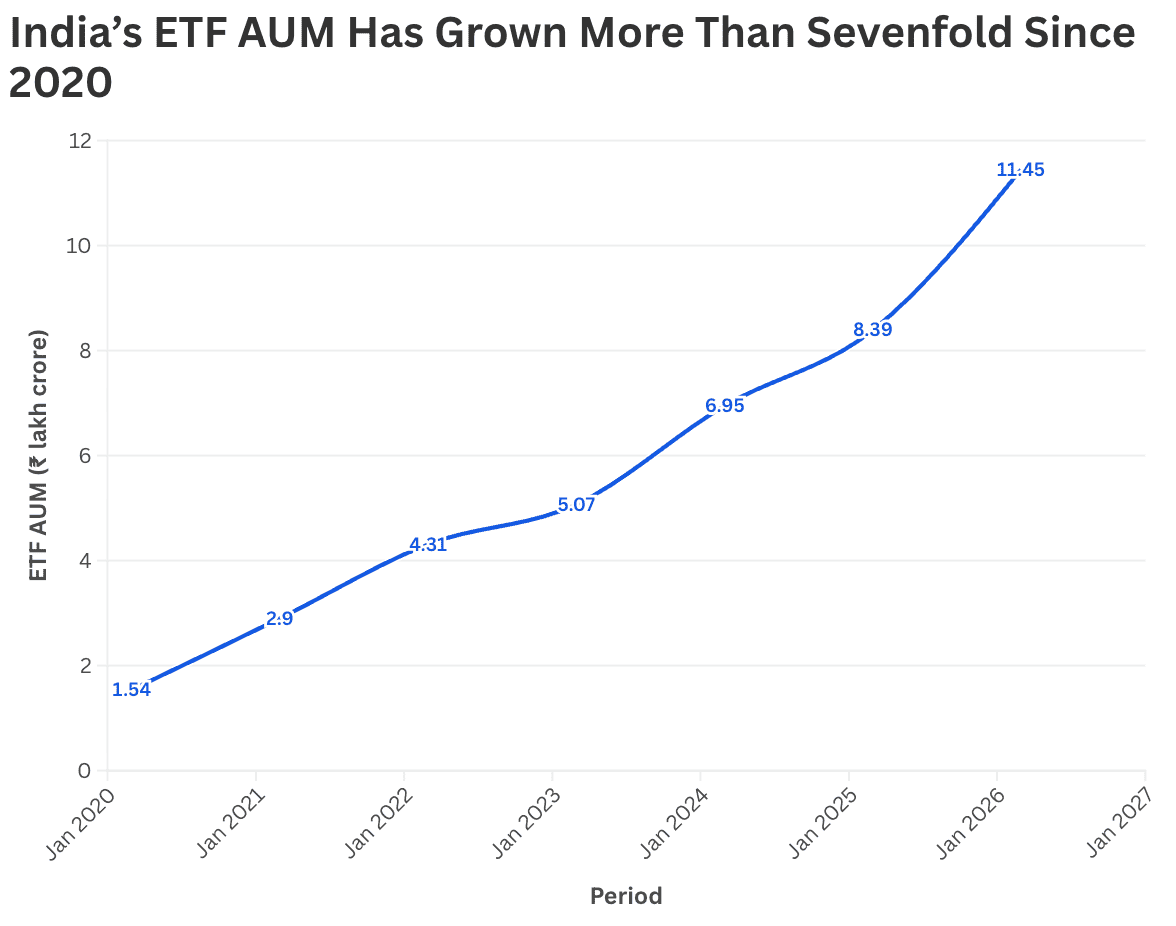
Source: AMFI Monthly Note, March 2020 and March 2025; HSBC, March 2026; Zerodha Fund House.
* March 2026 figure is the approximate INR conversion of US$119.8 billion reported for India's ETF market, using an exchange rate of ₹95.59 per US$1
Retail participation has also broadened significantly. Retail ETF folios increased more than elevenfold, from 23.22 lakh (2.32 million) in March 2020 to 2.63 crore (26.3 million) by March 2025. Retail ETF AUM more than tripled over the same period, rising from ₹5,335 crore (US$558.1 million) to over ₹17,800 crore (US$1.86 billion). The increase in both folios and retail AUM indicates that ETF participation has broadened significantly among individual investors.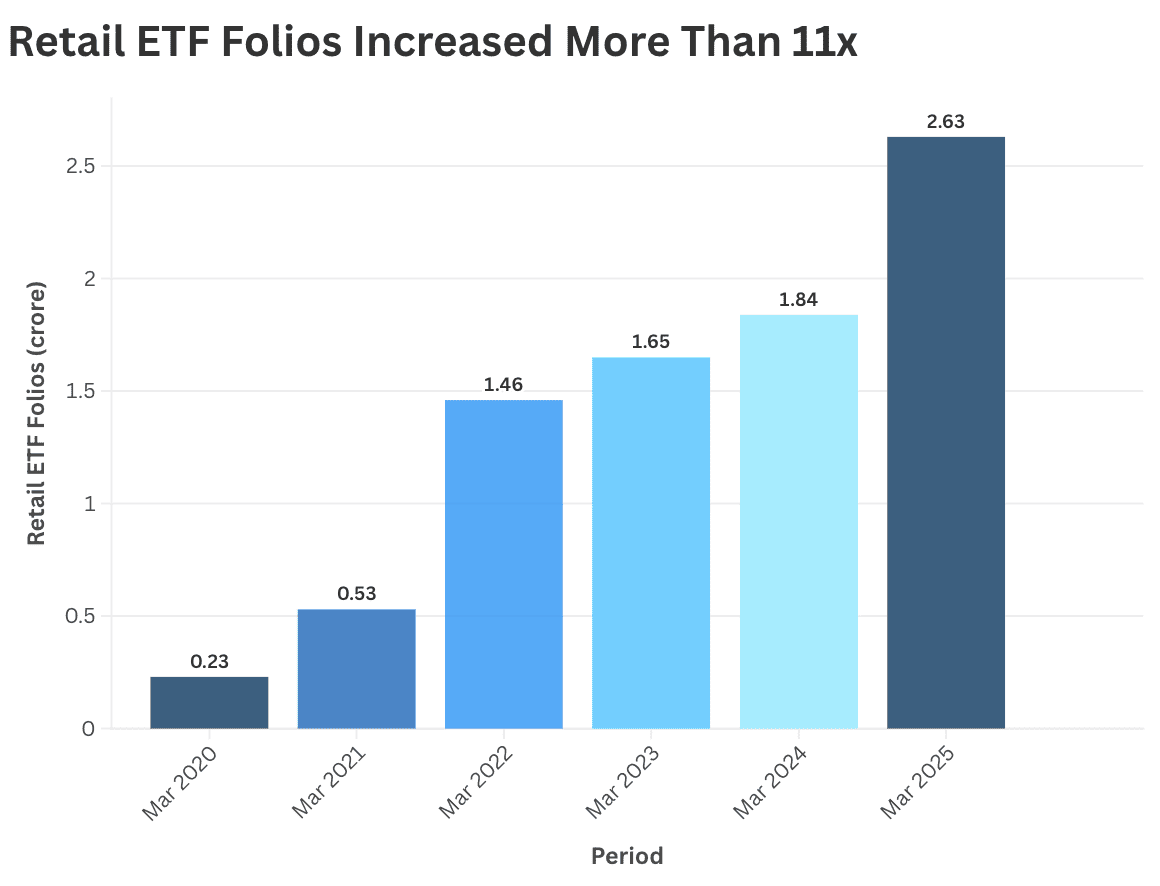
Trading activity has also accelerated sharply. ETF trading volume increased more than sevenfold, from ₹51,101 crore (US$5.35 billion) in FY2019-20 to ₹3,82,648 crore (US$40.03 billion) in FY2024-25. Net ETF inflows have remained positive for nine consecutive years, rising from ₹24,054 crore (US$2.52 billion) in FY2016-17 to ₹68,226 crore (US$7.14 billion) in FY2024-25.
Source: Nifty Passive Insights; Zerodha Fund House.
Types, Benefits, and How ETFs Compare
Indian ETFs span six broad categories:
- Equity ETFs: Track broad-market indices such as the Nifty 50 or Sensex, providing diversified exposure to Indian equities.
- Debt/Bond ETFs: Provide exposure to government securities, corporate bonds, or other fixed-income instruments.
- Gold and Silver ETFs: Offer exposure to precious metals without the need to physically store gold or silver.
- International ETFs: Track overseas indices such as the Nasdaq-100, giving investors access to global markets.
- Sectoral/Thematic ETFs: Focus on specific sectors or themes, such as banking, infrastructure, defence, or technology.
- Liquid/Money-Market ETFs: Invest in short-term money-market instruments and can be used to manage or park surplus cash.
Across these categories, ETFs offer several advantages, including diversification through a single unit, generally lower expense ratios than actively managed funds, regular disclosure of holdings, and the ability to trade throughout exchange hours. Their typically lower portfolio turnover can also reduce taxable distributions, while a single ETF trade can provide exposure to a broad basket of securities.
The key distinction versus a regular mutual fund is timing: mutual funds transact once daily at end-of-day NAV, while ETFs trade continuously at market-determined prices. Compared with an index fund tracking the same benchmark, an ETF trades intraday and requires a demat account, while an index fund may be more suitable for investors who prefer automated SIPs without one.
Costs, Investing, and Taxation
Costs include the expense ratio, brokerage fees per transaction, the Securities Transaction Tax, and the bid-ask spread, which widens in less liquid funds. Tracking error, which measures the variability in the difference between an ETF's returns and its benchmark's returns, isn't a direct cost but is an important measure of how closely the fund tracks its index; efficient management and lower costs tend to keep it low. To invest, open a demat and trading account with a SEBI-registered broker, pick a category that matches your goal, compare specific funds on expense ratio, tracking error, trading volume, and AUM, then place a buy order during market hours, like any stock trade. Since several ETFs often track the same index, the specific fund matters as much as the category; larger, more liquid funds with lower tracking error and costs are generally preferable, subject to verification.
Taxation depends on ETF type and holding period: equity ETFs are broadly taxed like equity-oriented mutual funds, while debt and commodity (Gold/Silver) ETFs may follow different rules, so a tax professional should be consulted for specifics. Two practical limitations are worth keeping in mind: ETF units cannot be bought or sold in fractions, and brokerage and demat charges add to the overall cost of ownership. ETF liquidity can also vary significantly between funds, meaning investors may face wider bid-ask spreads or greater price impact when trading less-liquid ETFs.
Bottom Line
India's ETF market remains young relative to global peers but has grown consistently across assets, product count, and retail participation, backed by nine straight years of positive net inflows and steady EPFO support. ETFs are increasingly becoming an important portfolio-building tool for Indian investors, though returns are never guaranteed and suitability depends on individual goals and risk tolerance.