
Global ETF/ETP assets reached a record US$23.11 trillion at the end of July after investors poured a record US$383.6 billion into the industry during the month, according to ETFGI's July 2026 Global ETFs and ETPs report. Year-to-date net inflows climbed to a record US$1.71 trillion, extending the industry's streak of consecutive monthly inflows to 86 months. That figure surpasses the prior record of $1.09 trillion set over the same period in 2025, and the $944.18 billion recorded through July 2024, underscoring how exceptional this year's pace of demand has been.
Record Flows Reshape the ETF Market
Global ETF/ETP assets rose 16.6% year-to-date, from $19.84tn at the end of 2025 to $23.11tn in July, only marginally ahead of the $23.09tn recorded at the end of June. Of the $23.11tn combined total, ETFs alone account for $22.51tn, with the remaining ~$601bn held in ETPs (grantor trusts, notes and other non-fund structures). Net subscriptions of $1.71tn YTD are far below the roughly $3.27tn increase in total AUM over the same period, the gap reflecting market appreciation, currency effects, and other valuation changes rather than fresh money alone. July made that gap unusually visible: a record $383.6bn of net new money added only about $20bn to month-end assets, even as major equity markets were broadly flat to slightly lower during the month (the S&P 500 slipped 0.06% in July).
ETF Growth Extends Beyond Assets
The AUM record sits atop an equally dramatic expansion in the product universe itself. ETFGI's historical chart shows that ETF/ETP assets have compounded at a 20.6% rate over the past 10 years.
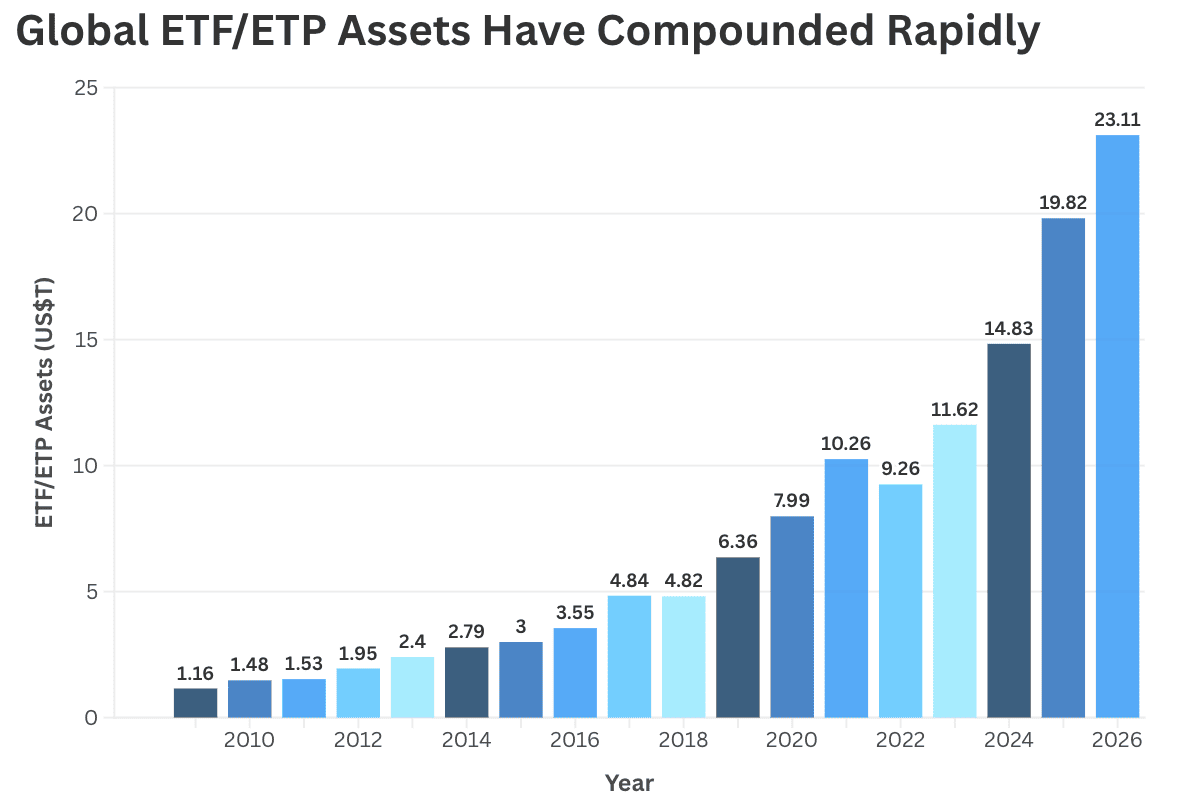
Growth, in other words, hasn't just been about bigger cheques into existing funds; the number of listed ETFs/ETPs has grown roughly seven-fold since 2009, giving investors a far wider menu to allocate across.
Market Performance Adds Context
Broad market moves help explain why a record month of inflows barely moved total AUM. ETFGI's report notes the S&P 500 was roughly flat in July, while developed and emerging markets diverged.
Flows Are Broadening Beyond Core Equity
Equity ETFs still captured the largest share of new money, while active strategies grew fastest in relative terms (+83% YoY) and fixed income continued to attract substantial allocations. Because "active" describes a management style rather than an asset class, an actively managed bond fund can appear in both the active and fixed-income totals below. Separately, State Street Investment Management's H1 2026 report found that US-listed bond ETFs attracted about $300bn, equivalent to roughly 29% of US ETF inflows despite representing only about 16% of US ETF assets.
ETF Growth Remains Concentrated Among the Biggest Issuers
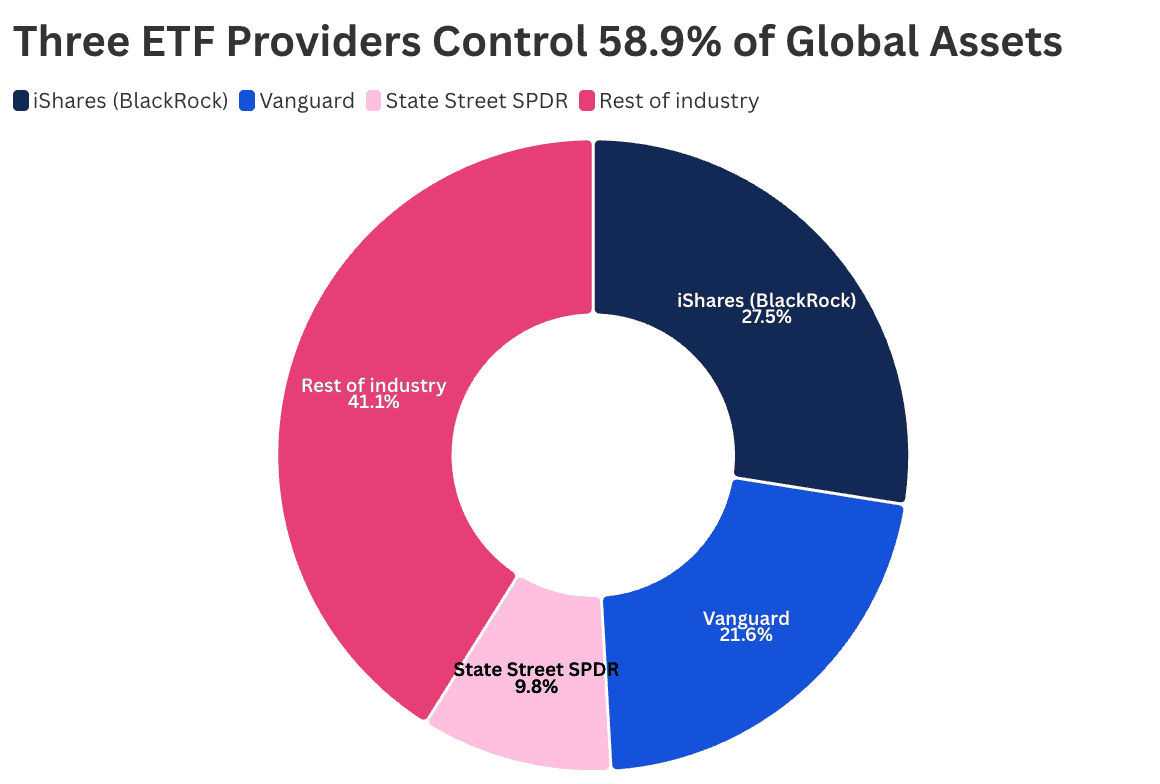
Product supply is expanding rapidly: 2,141 ETFs launched YTD against 353 closures, bringing the global count to 17,654 ETFs and 34,072 listings across 85 exchanges in 66 countries. Yet capital remains concentrated at the top, with the remaining 1,022 providers each holding less than a 5% market share.
US Equity and Active ETFs Lead July Flows
The largest ETF flows in July remained concentrated in US equities and semiconductor strategies, with the 20 largest ETFs attracting $125.96bn in net new assets (NNA), roughly one-third of the industry's $383.6bn in monthly inflows. The Vanguard S&P 500 ETF (VOO) led with $19.66bn, followed by SPY at $13.55bn. Semiconductor and technology-focused ETFs also featured prominently, while regional funds tracking South Korea and Taiwan recorded strong inflows.
Active ETFs were another major source of demand. They attracted $89.58bn in July, bringing YTD inflows to $590.46bn, up sharply from $322.69bn during the same period in 2025. This highlights how investor demand is extending beyond traditional index-tracking products.
NNA = net new assets, representing net investor inflows or outflows.
On the ETP side, the top 10 recipients attracted $3.28bn in July, led by gold, silver and Ethereum products. Invesco Physical Gold ETC (SGLD) was the largest recipient at $688.47mn, followed by iShares Silver Trust (SLV) at $400.69mn and iShares Ethereum Trust (ETHA) at $388.25mn. Several remained negative YTD, indicating that July's inflows represented a rebound rather than a complete reversal of earlier outflows.
International and Emerging Markets Capture More Flows
The record haul isn't only about how much is flowing into ETFs, but where. State Street's H1 2026 data shows non-US ETFs captured about 34% of inflows despite representing only around 20% of assets, while emerging-market ETFs pulled in roughly $38bn, the strongest first half on record for the category, with about 73% of EM-focused ETFs posting inflows. Alongside the $441bn gathered by US equity ETFs, a further $228bn went into ETFs with more globally diversified exposure in H1. This broadening across US, international, equity and fixed-income exposures is a key part of why 2026 inflows have outpaced every prior year.
Bottom Line
Global ETF/ETP demand reached a new high in July, with record inflows pushing YTD net subscriptions to $1.71 trillion. The flows show that investors are broadening beyond traditional US equity exposure into active strategies, fixed income, international markets, commodities, and targeted duration plays. While the industry remains highly concentrated among a few major providers, the rapid expansion in products and strategies suggests ETFs are becoming an increasingly central tool for portfolio allocation.
Source: ETFGI, July 2026 Global ETFs and ETPs Industry Landscape Insights Report.