A company can report strong accounting earnings while generating relatively weak free cash flow. Depreciation, working capital movements, one-time charges, and revenue recognition rules can all create a gap between the earnings figure that headlines usually lead with and the cash a business actually generates. Free cash flow offers a different view by focusing on the cash a company generates from its operations after capital expenditures, providing a measure of the cash available for reinvestment, debt reduction, distributions, or other corporate uses. It is not a perfect measure either. Free cash flow can swing with the timing of working capital and capital spending cycles, which is part of why the funds below build different screens around it.
A small group of U.S.-listed ETFs has made free cash flow a central part of its stock selection process. For GCC investors who access US markets through international brokerage accounts and digital wealth platforms, these funds offer a concentrated way to own companies with strong cash generation rather than a broad market index.
The Free Cash Flow Lens
Free cash flow yield relates a company's cash generation to its enterprise value, commonly calculated as market capitalization plus debt minus cash, similar to how earnings yield relates earnings to a company's valuation. A company with a high free cash flow yield is generating a lot of cash relative to the value of the business. Not every fund in this group uses yield specifically. Some screen on free cash flow margin instead, which relates free cash flow to sales rather than valuation, and the difference shapes which companies each fund ends up holding.
COWZ is the oldest and largest of the group, holding about 20.1 billion dollars in assets as of mid September 2026, with an expense ratio of 0.49%. VFLO launched more recently, in 2023, and has grown quickly, reaching about 11 billion dollars in assets over the same period, with a gross expense ratio of 0.44% and a net expense ratio of 0.39%. FLOW takes a similar approach on paper but has not gathered nearly the same asset base, holding just over 34 million dollars despite the lowest expense ratio in the group at 0.25%. Size differences like this matter for GCC investors because smaller funds tend to trade with wider bid-ask spreads, which adds a real cost on top of the stated expense ratio.
Why the strategies produce different portfolios
COWZ ranks its universe by trailing free cash flow yield, COWZ ranks its universe by trailing free cash flow yield, which can produce greater exposure to cyclical and value-oriented companies. VFLO blends forward estimates into its screen, which shifts its portfolio toward companies expected to keep generating cash rather than ones that generated it last year. FLOW applies a 25% sector cap and a 2% individual stock cap, limiting concentration within the portfolio. QOWZ emphasizes a long history of cash generation, requiring 11 straight years of positive free cash flow before a company is even eligible for the index. DSTL takes a different angle, combining a normalized free cash flow valuation with balance sheet quality and generally avoiding heavily leveraged companies. The practical result is that these funds, despite sharing a common label, can behave quite differently during the same market environment, and some carry higher turnover than others. VFLO, for instance, reported portfolio turnover of 149% for the period ending August 31, 2026, well above what a plain market cap index fund would show.
Why free cash flow ETFs matter for GCC investors
Free cash flow ETFs are U.S.-listed products that give GCC investors another way to build U.S. equity exposure. Rather than simply tracking the broad market, these strategies focus on companies selected for characteristics such as free cash flow yield, cash flow consistency, or free cash flow margin.
For GCC investors, the attraction is therefore less about finding a better version of the S&P 500 and more about gaining exposure to a different set of fundamental characteristics. Global ETF industry assets reached a record 24.03 trillion dollars at the end of August 2026, according to ETFGI, and the differences in methodology across these funds can lead to meaningful variations in sector exposure, concentration, and performance.
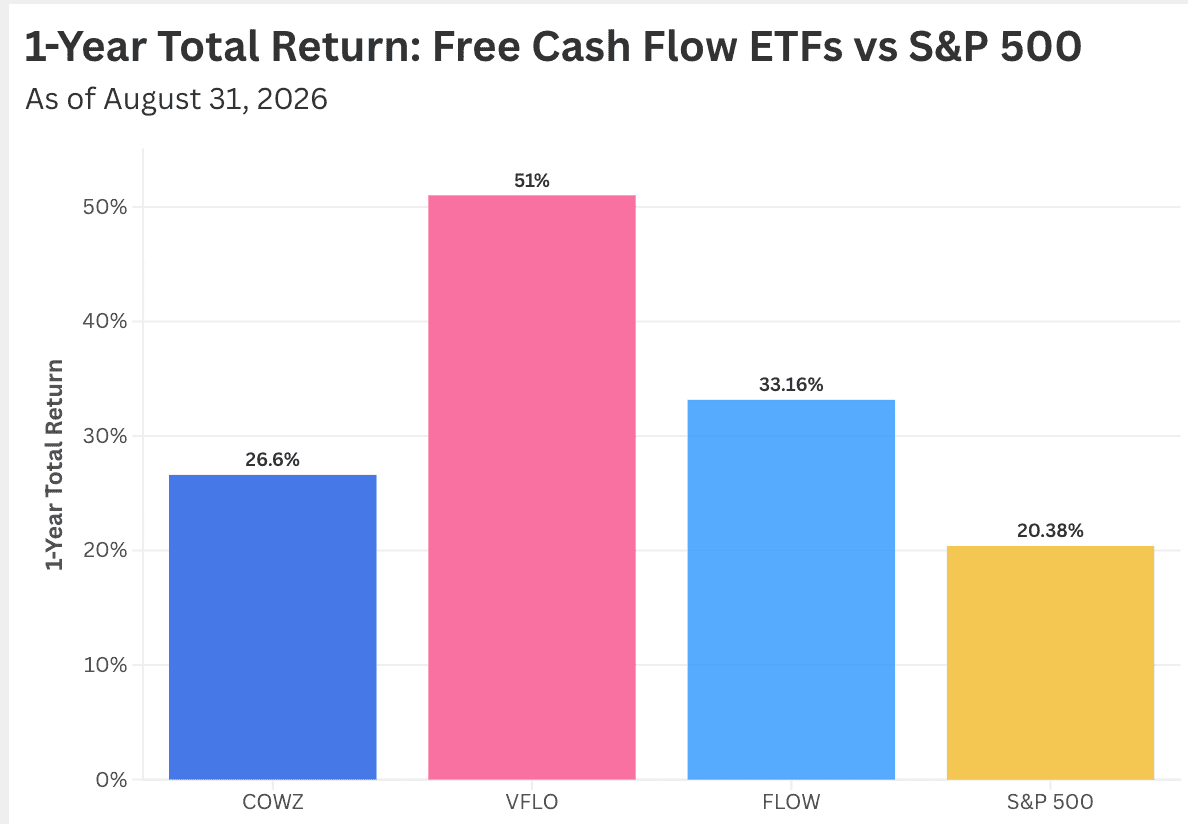
The performance differences show that ETFs built around free cash flow can produce materially different results depending on how they define and apply the metric.
Sector Exposure Across Free Cash Flow ETFs
The sector breakdown shows that free cash flow strategies are not interchangeable. COWZ has relatively high exposure to health care and industrials, while VFLO has larger allocations to technology and energy. FLOW is more concentrated in technology and consumer discretionary.
Risks of Free Cash Flow ETF Investing
None of this makes free cash flow investing a shortcut to outperformance. These funds carry real sector tilts and concentration in specific industries, and turnover varies meaningfully from one strategy to the next, all of which can affect returns and trading costs over full market cycles. What the free cash flow lens does offer is a different filter than earnings alone, What the free cash flow lens does offer is a different filter from earnings alone, one that GCC investors researching U.S. equity exposure can consider alongside broader market-cap-weighted strategies.