KMCA US · ETF Factsheet
PLUS Korea Manufacturing Core Alliance Index ETF
Generated by Nukoud (nukoud.com) for informational purposes only — not investment advice, a recommendation, or an offer to buy or sell any security. Data is sourced from third-party providers and may be delayed or inaccurate. Past performance is not indicative of future results.

PLUS Korea Manufacturing Core Alliance Index ETF
 Exchange-Traded Fund
Technical indicators
End of dayMoving averages
- 20-day SMA
- 17.4507 USD-8.35%Bearish
- 50-day SMA
- 18.9939 USD-15.80%Bearish
- 100-day SMA
- 18.9985 USD-15.82%Bearish
- 200-day SMA
- ———
- 12-day EMA
- 16.8086 USD-4.85%Bearish
- 26-day EMA
- 17.6543 USD-9.41%Bearish
Oscillators
Sign in for the oscillators
RSI, MACD, Bollinger position and volatility for this fund — plus signal changes across every listing Nukoud tracks. A free account covers it.
Checking your session…Range & bands
Calculated from end-of-day closing prices. They describe how this fund has already traded, not what it will do next, and are information only — not advice.
About this fund
PLUS Korea Manufacturing Core Alliance Index ETF (KMCA) is a Miscellaneous Sector ETF managed by Exchange Traded Concepts, LLC, listed on NYSE Arca, quoted in USD. It charges a 0.65% net expense ratio and holds $4.87M in assets as of Nov 3, 2026. The fund launched on May 6, 2026.
- Benchmark
- N/A
- Distribution
- Annually
- AUM
- $4.87M
- Expense Ratio
- 0.65%
- Yield (12-mo)
- —
- Morningstar Rating
- Benchmark
- N/A
- 52-Week Range
- Avg Daily Vol
- 3.5K
- Inception
- May 6, 2026
Risk metrics
vs benchmark N/A
3-year risk statistics are not currently available for this fund.
Risk statistics are 3-year, month-end-based.
Trailing returns
As of Nov 3, 2026Calendar-year returns
Morningstar daily closesTrading & liquidity
as of Nov 3, 2026
Average daily share volume over each trailing window. Spread is the average bid-ask spread as a percentage of price — lower means cheaper to trade.
Top 10 holdings
Source: MorningstarFees & expenses
Classification
- Category
- Equity – ThematicOther Thematic
- Asset class
- Equity
- Strategy
- Passive
- Sector
- Industrials
- Country
- South KoreaEmerging Markets
- Issuer
- Exchange Traded Concepts, LLC
- Branding
- Plus
Similar ETFs
Funds sharing the same category or exposures.
- KDEFUS$84.69M0.650%-26.83%
PLUS Korea Defense Industry Index ETF
Same group · Same sector · Same country
- PAVEUS$14.10B0.470%+14.93%
Global X U.S. Infrastructure Development ETF
Same group · Same sector
- ITAUS$12.43B0.370%+0.94%
iShares U.S. Aerospace & Defense ETF
Same group · Same sector
- SHLDUS$6.58B0.500%-1.87%
Global X Defense Tech ETF
Same group · Same sector
- KWEBUS$4.32B0.690%-31.63%
KraneShares CSI China Internet ETF
Same group · Same region
- EUADUS$934.89M0.500%-6.62%
Select STOXX Europe Aerospace & Defense ETF
Same group · Same sector
Frequently asked questions
- What is KMCA's expense ratio?
- PLUS Korea Manufacturing Core Alliance Index ETF charges a net expense ratio of 0.650%.
- How large is PLUS Korea Manufacturing Core Alliance Index ETF?
- KMCA holds $4.87M in assets under management.
- What index does KMCA track?
- PLUS Korea Manufacturing Core Alliance Index ETF tracks N/A as its primary benchmark.
- When did KMCA launch?
- PLUS Korea Manufacturing Core Alliance Index ETF launched on May 6, 2026.
- What currency does KMCA trade in?
- KMCA trades in USD on NYSE Arca.
News & analysis on KMCA
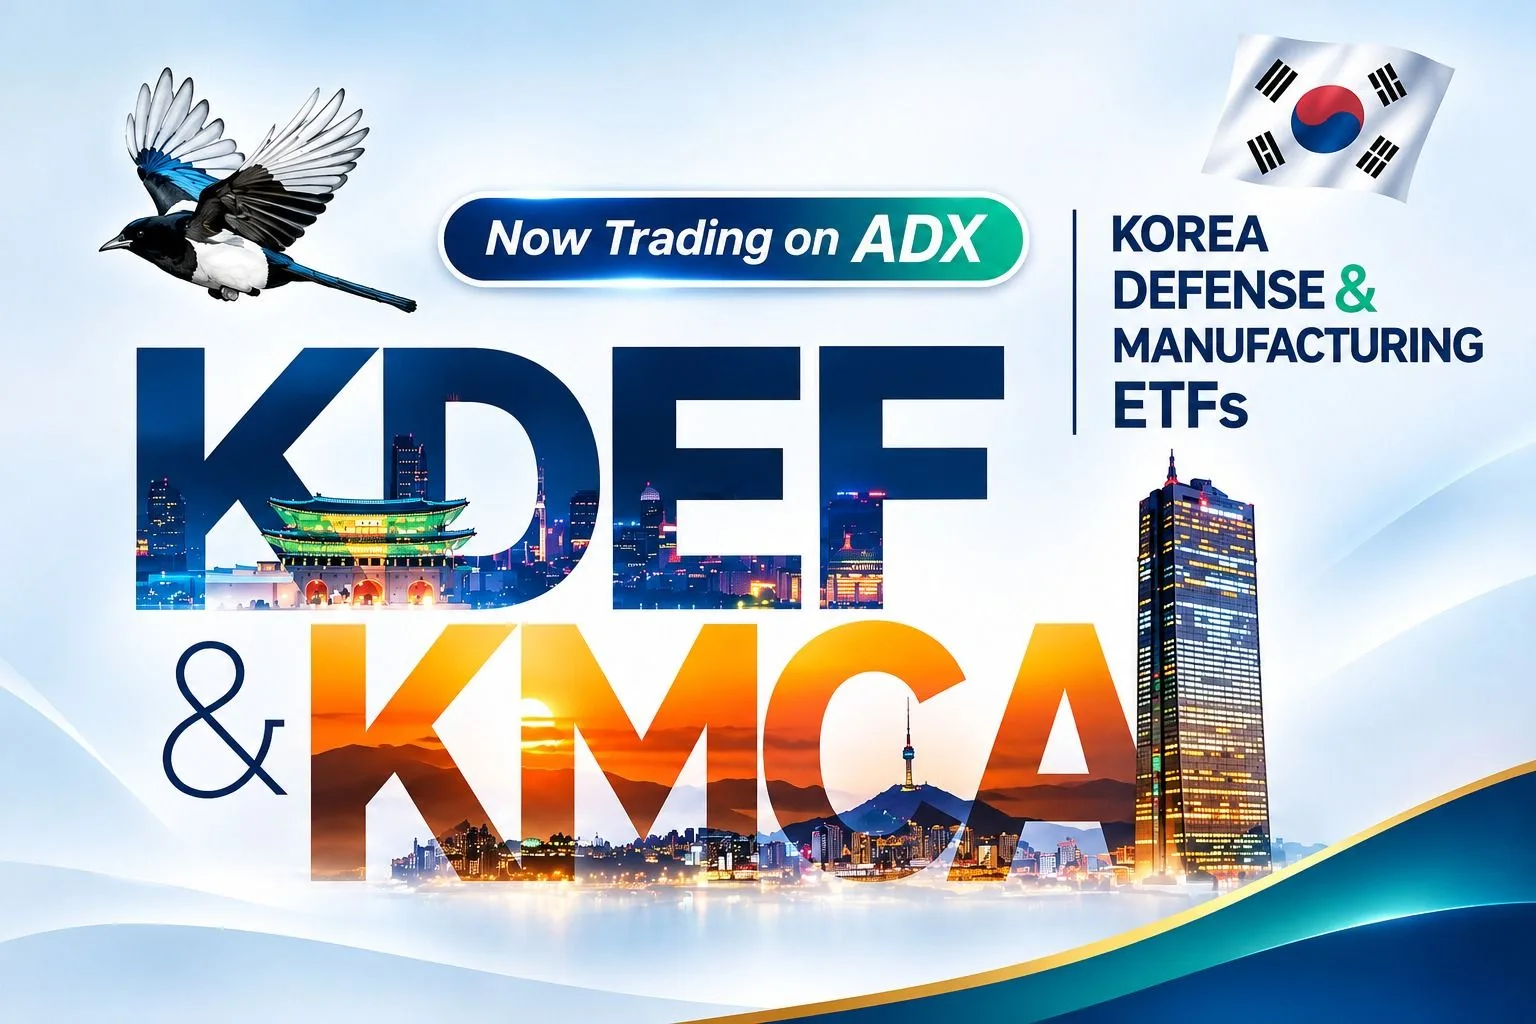
Korean Defense and Advanced Manufacturing ETFs listed on ADX on November 2nd
Two Korean ETFs, KDEF and KMCA, Set to Begin Trading on ADX November 2, With OCEANE as Market Maker
SK Hynix Revenue Surges 328% as AI Memory Demand Drives Record Earnings
ADX ETF Launch: Korea Defense and Advanced Manufacturing NYSE-Listed ETFs KDEF and KMCA Approved for ADX Cross-Listing as Early as Next Week.
Fund information
- Ticker
- KMCA
- Performance ID
- 0P00020DG8
- Inception
- May 6, 2026
- Domicile
- USA
- Base currency
- USD
- Listing currency
- USD
- AUM
- $4.87M
- Avg daily volume (3M)
- 3.5K
Charting by TradingView.