
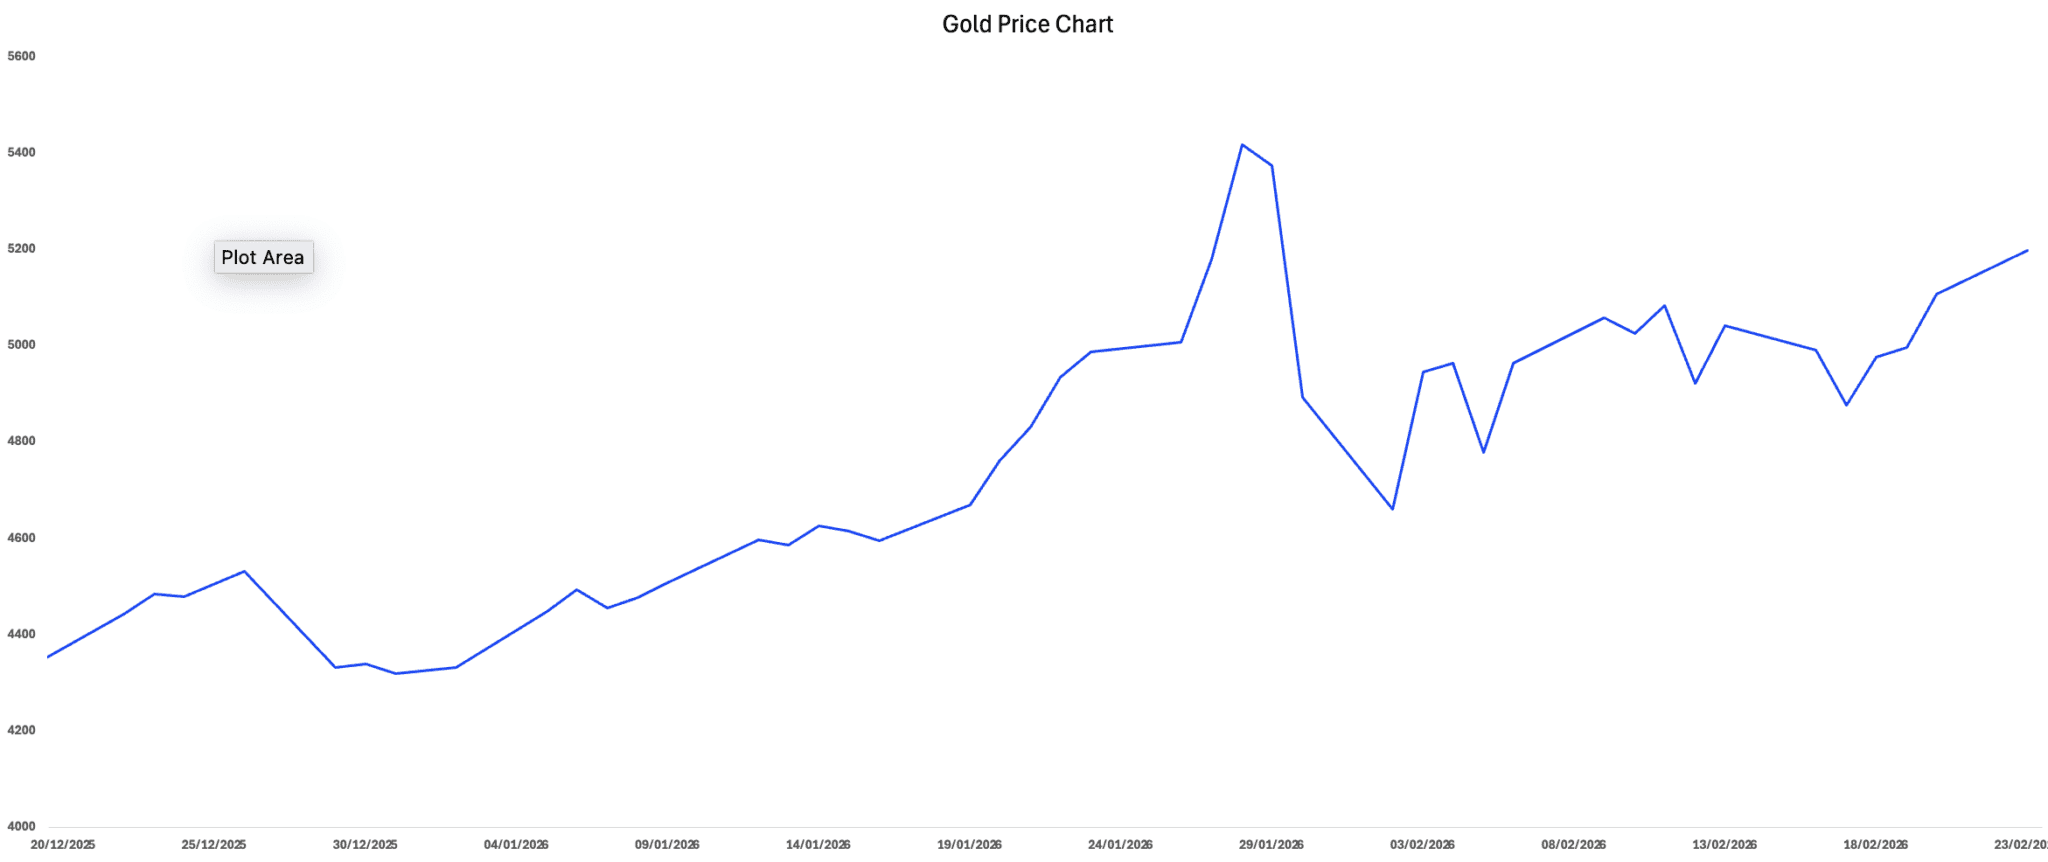
In early 2026, gold prices went from record highs, into a sharp correction, and now back on the offensive, a classic fear-to-confidence pivot in global markets. After climbing above $5,590 per ounce in late January, spot gold plunged nearly 21% toward the mid-$4,400s in a rapid selloff that wiped out weeks of gains and spooked even long-term bulls.
What followed wasn’t capitulation but recovery. Prices rebounded above the $5,000 level and have pushed higher in recent sessions, driven by renewed safe-haven demand amid geopolitical friction, weakening dollar dynamics, and expectations of future rate cuts by the U.S. Federal Reserve.
With gold resuming its momentum, here why ETFs tracking gold are regaining investors’ favor again as an important component in their portfolios.
Why Gold is Rising Again
The rebound in gold has been fundamentally driven, but not simply by headlines. After an initial correction sparked by profit-taking, a stronger U.S. dollar, and temporary repricing of Federal Reserve rate-cut expectations, the macro backdrop quickly realigned in gold’s favor.
Three forces powered the recovery.
First, real yields declined. As inflation expectations stabilized and bond yields retreated from recent highs, the opportunity cost of holding non-yielding bullion fell. Gold is highly sensitive to real (inflation-adjusted) rates, and even modest moves lower tend to unlock institutional demand.
Second, geopolitical risk premiums returned decisively. Renewed U.S.–Iran tensions and tariff uncertainty injected volatility into equities and oil markets simultaneously, a combination that historically channels capital into hard assets.
Third, and most structurally important, institutional flows accelerated rather than hesitated. The record US$19 billion in January inflows into gold-backed ETFs signaled allocation decisions, not retail fear. Total ETF assets climbed to roughly US$669 billion, with global holdings surpassing 4,100 tonnes, a scale that reflects strategic positioning by asset managers, sovereign institutions, and multi-asset funds.
This is what differentiates the rebound from a technical bounce. The recovery has been supported by falling real yields, policy uncertainty, central bank accumulation, and sustained ETF inflows from a multi-layered demand base rather than a single catalyst.
In other words, gold didn’t just recover. It re-established its macro footing.
GLD vs. GDX in 2026
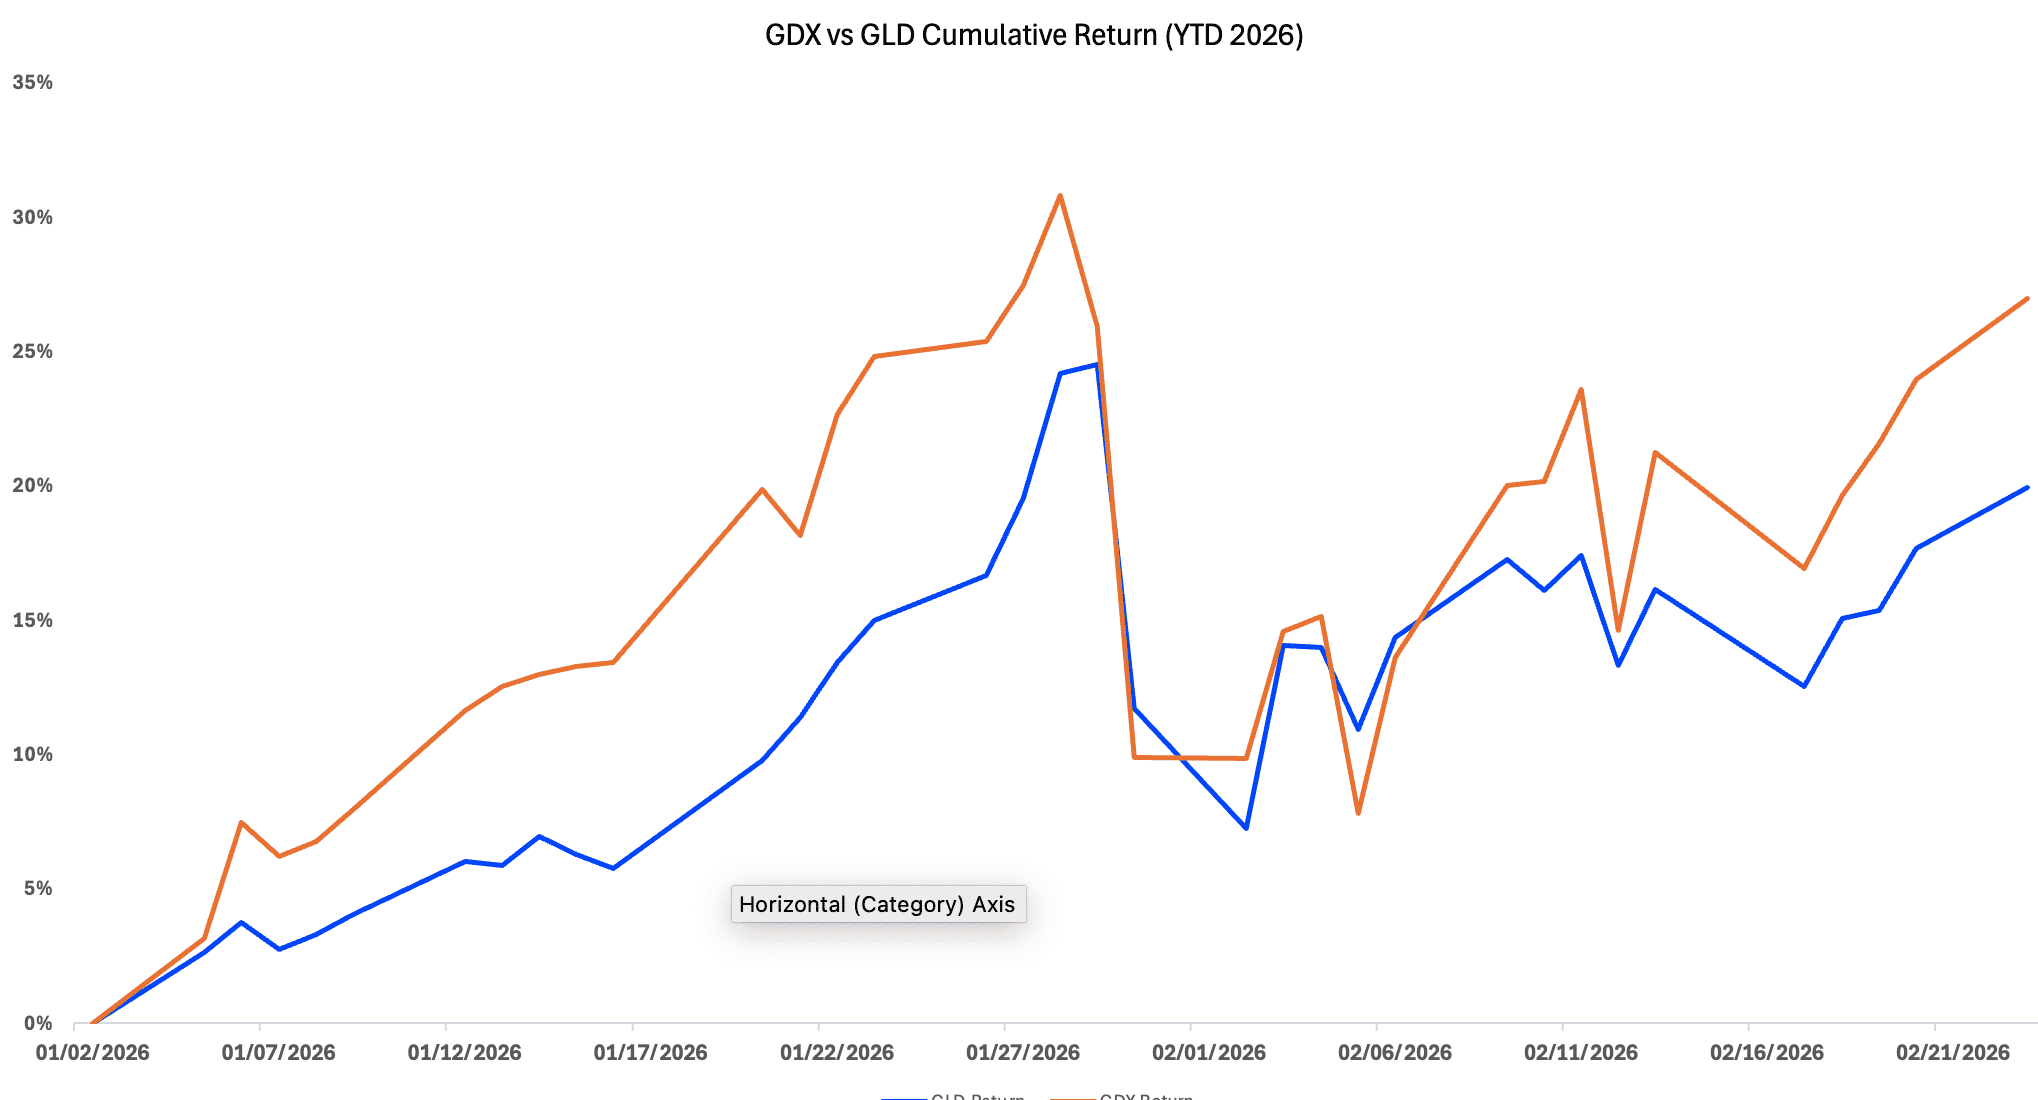
In 2026, the divergence between GLD (SPDR Gold Shares) and GDX (VanEck Gold Miners ETF) has narrowed compared to prior cycles, but their structural differences remain clear. GLD, which holds physical bullion, has delivered steady double-digit gains year-to-date alongside gold’s macro-driven rally, benefiting from falling real yields and renewed safe-haven demand. GDX, by contrast, has participated in the upside but with greater volatility, reflecting its exposure to mining company earnings, cost structures, and broader equity market sentiment. While miners can outperform bullion in strong gold regimes due to operational leverage, 2026 so far has favored the cleaner macro hedge of physical gold over equity beta, underscoring that GLD remains the defensive allocation, whereas GDX is the higher-conviction cyclical expression of the same theme.
What GCC/UAE Investors Should Know
Even without many domestic gold ETFs in regional markets, GCC and UAE investors can access major global gold ETFs via brokerages connected to Nasdaq Dubai or international markets.
Some relevant vehicles include:
- GLD (SPDR Gold Shares) tracks physical gold price and is the benchmark for direct metal exposure.
- GDX (VanEck Gold Miners ETF) invests in gold mining companies, adding equity and operational leverage on top of metal prices.
- Albilad Gold ETF (Saudi): a Shariah-compliant, physically backed gold ETF, offering local access without currency or foreign tax hurdles.
Gold mining stocks have also been enjoying strong tailwinds. Major producers such as Newmont, Gold Fields, and AngloGold Ashanti reported significant earnings and profit growth driven by higher bullion prices, boosting miner cash flows and returns in early 2026.
Gold is Portfolio Material
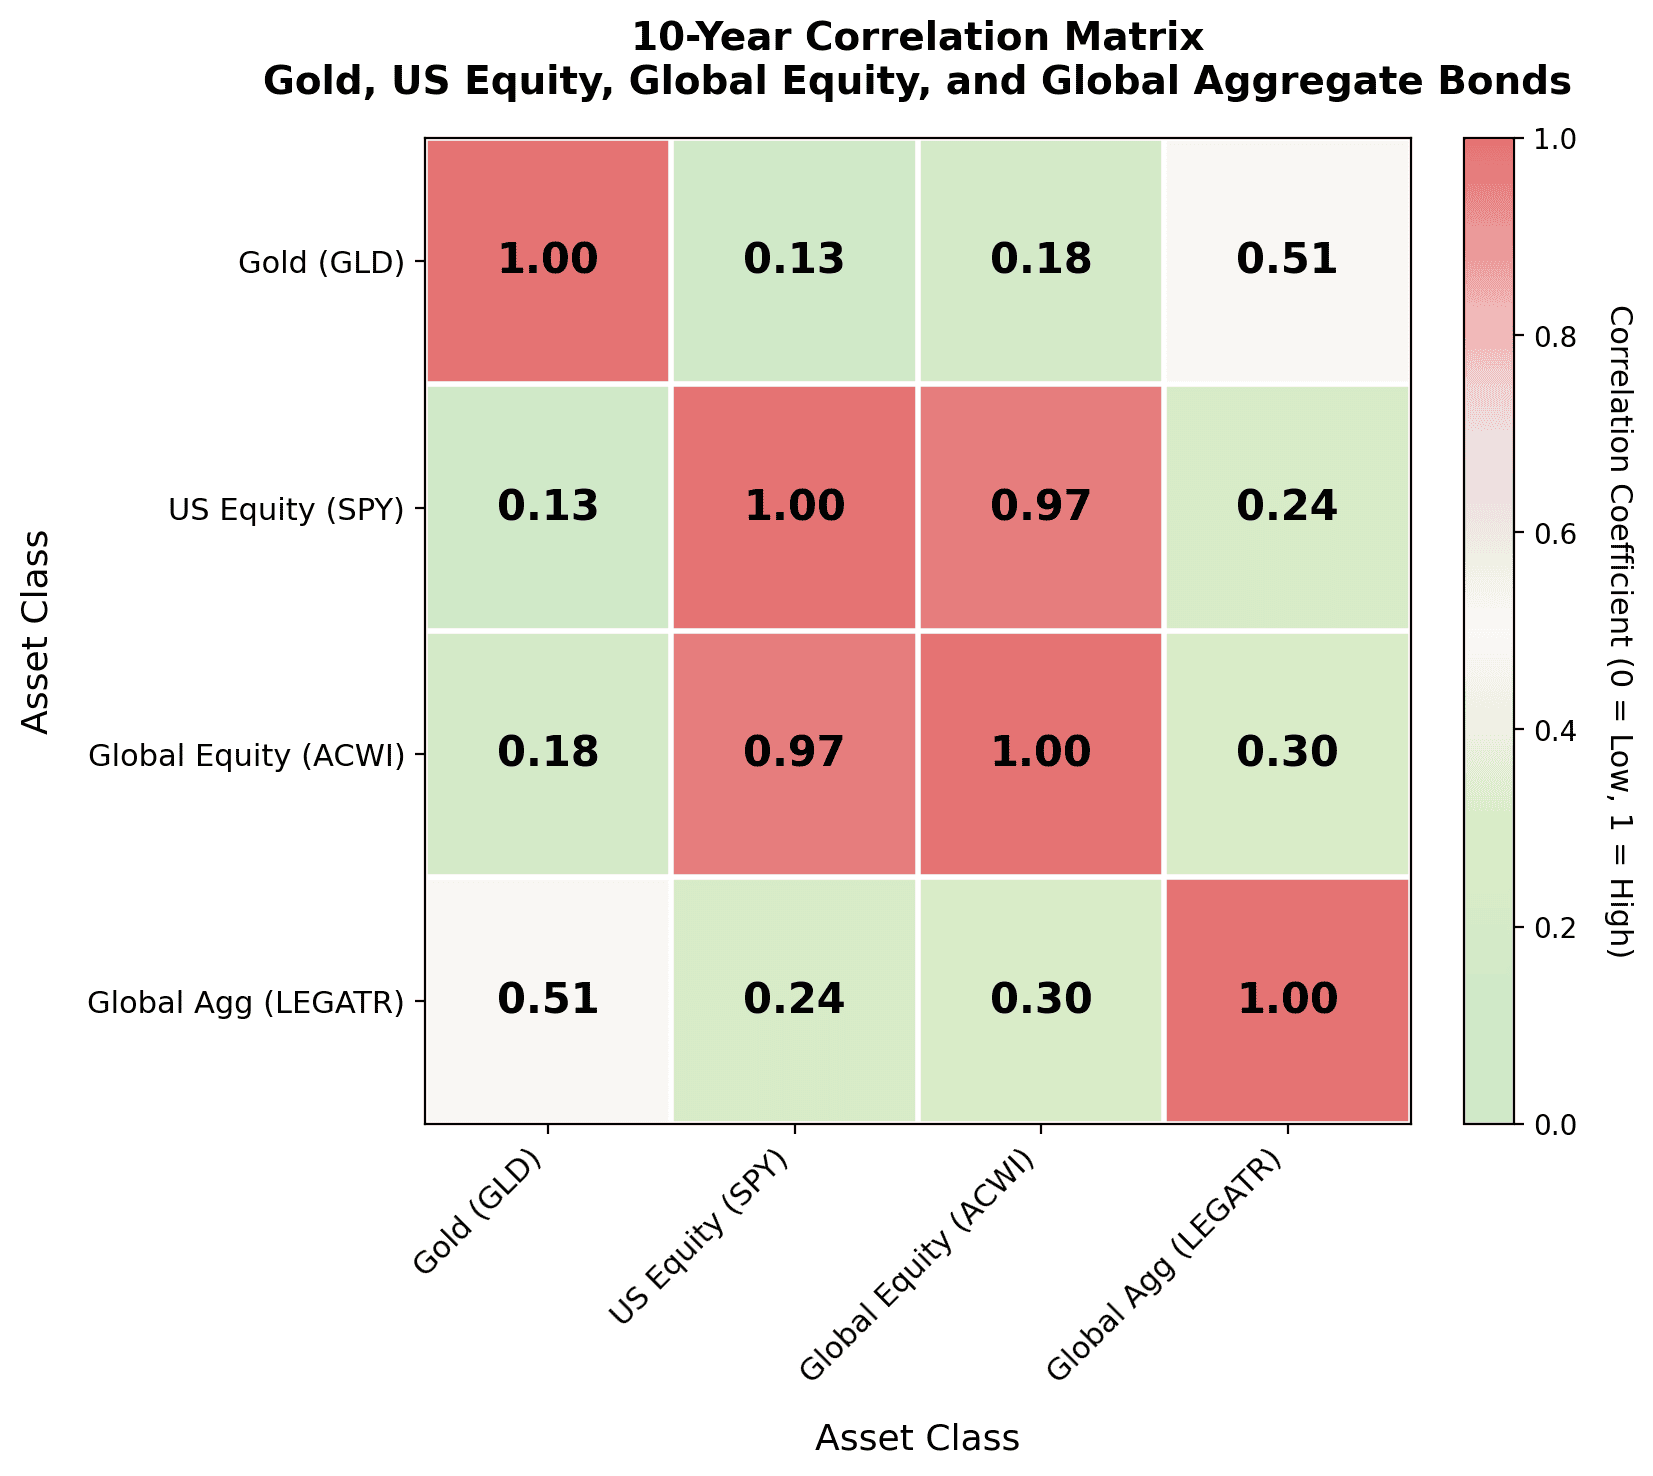
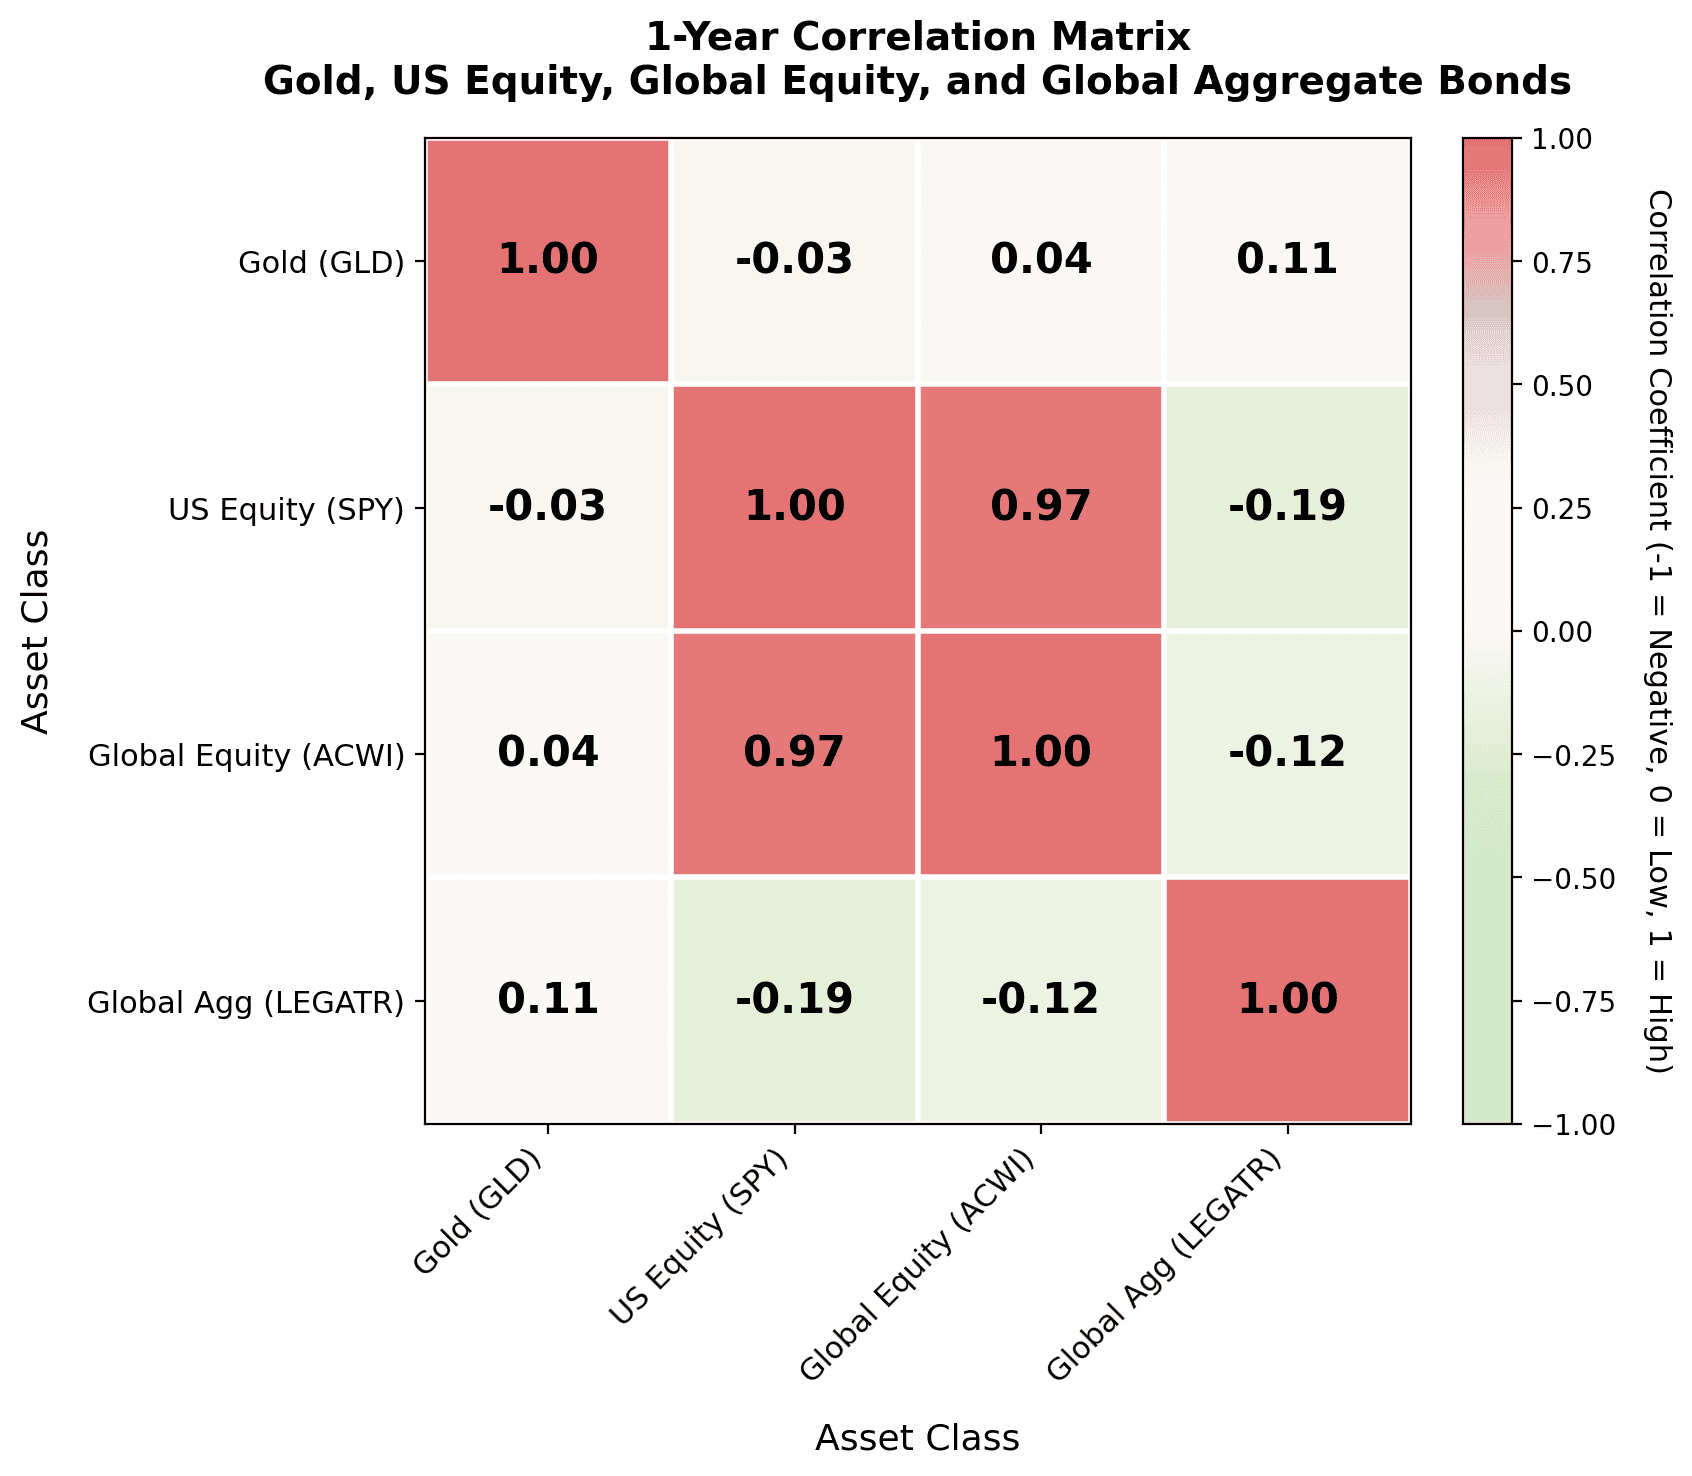
Importantly, gold does not move in lockstep with equities. Long-term data shows gold’s correlation with the S&P 500 is low and regime-dependent, often diverging during stress periods. That diversification characteristic is precisely why capital returned quickly after the correction.
Diversification has been even more pronounced over the past year. Correlation between gold and equities and fixed income has been lower than the long term average. With SP 500, gold correlation is actually negative. Gold is not just looks but also brains in this current investment cycle. See tables below that compares 10 years correlation with 1 year.
Takeaway
Gold isn’t just back, it’s being actively recalibrated in portfolios. Record ETF flows show demand beyond knee-jerk hedging, while miners capture amplified return potential when bullion prices surge.
For GCC investors, the key decision is how to express gold exposure via low-volatility physical ETFs, higher-beta miner ETFs, or a mix while considering liquidity, Shariah alignment, domicile, and tax implications.
The moral of the story seems to be that Gold continues to play an integral role in investors’ portfolios