Gold prices fell below $4,000 an ounce on October 23, 2026, for the first time since mid-July, bringing the metal's summer lows back into focus. The decline follows a sharp correction from gold's January peak and raises questions about whether prices can stabilise or face further selling.
For GCC investors, the pullback puts gold exchange-traded funds (ETFs) in focus, including Saudi Arabia's Albilad Gold ETF and US-listed funds offering exposure to bullion and gold-mining companies.
Despite the recent price correction, gold ETF demand remains an important trend to watch. Read our report on record gold ETF inflows in Q3 2026 to understand how investor demand has evolved.
Gold Price Today: Gold Falls Below $4,000 an Ounce
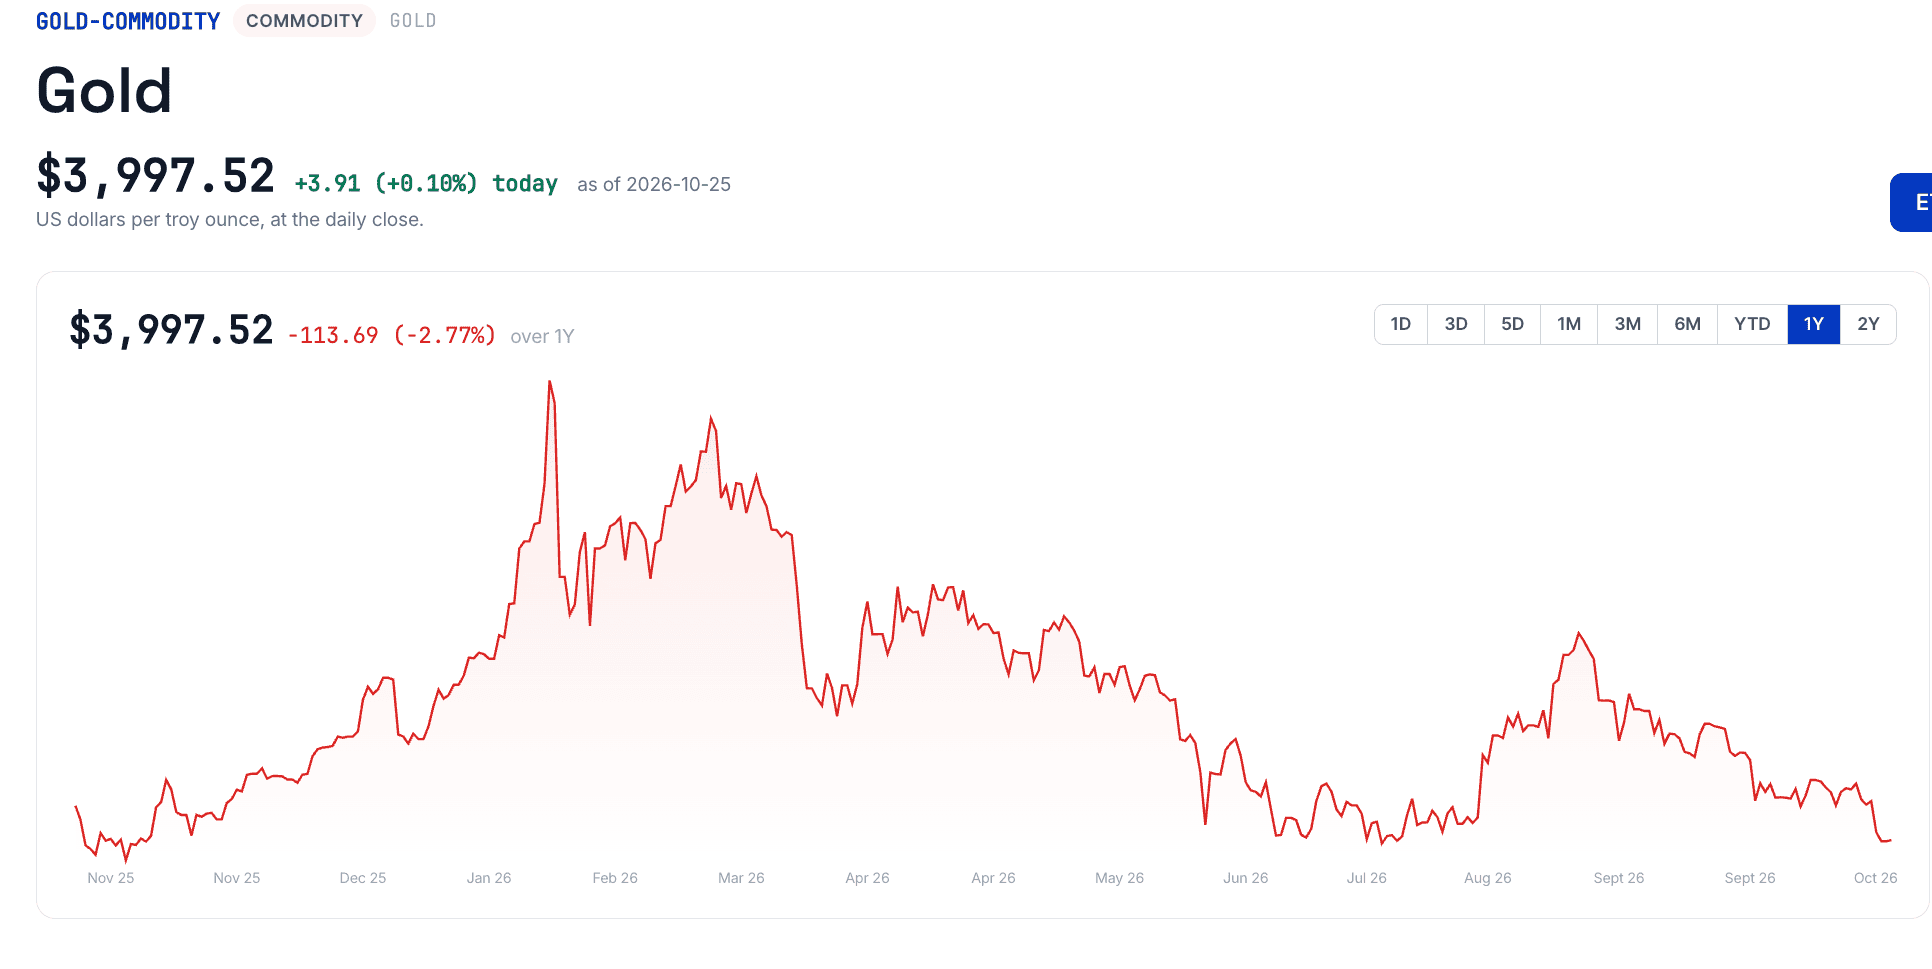
Gold stood at $3,997.52 per troy ounce. On October 23, spot gold fell below $4,000 for the first time since mid-July, reaching an intraday low of $3,975.23, according to Reuters. The figures reflect different observations and may have been recorded at different times.
Sources: Source: Nukoud
The $4,000 level matters because a sustained break can encourage further selling and bring technical support into focus. Investors are watching whether gold can recover above this threshold or retest its July lows.
Why Are Gold Prices Falling? Oil Prices, Inflation and Fed Rate Expectations
Interest rate expectations remain a major influence. Gold does not generate interest income, making it less attractive relative to interest-bearing assets when bond yields rise, or markets anticipate tighter monetary policy.
Oil prices have also added to inflation concerns. Higher energy costs can keep inflation elevated, potentially limiting the Federal Reserve's ability to ease monetary policy. A stronger US dollar and higher bond yields can further weigh on dollar-denominated bullion.
TradingKey's October 26 report attributed some of the selling pressure to technical trading and liquidity needs. Losses in technology stocks reportedly put leveraged investors under margin pressure, prompting some to sell liquid assets such as gold to raise cash. This is one reported explanation for the decline, rather than a confirmed cause of the entire sell-off.
Interest-rate expectations remain a key factor for gold. Reuters reported on October 26 that markets were pricing in approximately an 80% probability of a US Federal Reserve rate hike in December, while the probability of a hike at the October 27–28 meeting was much lower. Investors are assessing how the Fed's decision and the inflation outlook could affect bond yields, the US dollar, and gold prices.
Gold ETFs Compared: GLD, GLDM, GDX and GDXJ Performance
Gold investment products differ in their exposure, fees, and risk. Bullion-backed ETFs such as SPDR Gold Shares (GLD) and SPDR Gold MiniShares Trust (GLDM) track gold prices, while gold-mining ETFs such as GDX and GDXJ invest in mining companies. The latter are also affected by operating costs, profitability, and broader equity-market conditions.
Source: Nukoud ETF data. GLD, GLDM, GDX, and GDXJ returns are as of October 23, 2026; Albilad Gold ETF returns are as of October 25, 2026. Expense ratios are based on the displayed fund data.
The comparison shows that gold-mining ETFs experienced steeper one-month declines than bullion-backed products. GDX fell 14.28%, and GDXJ declined 18.08%, compared with a 6.69% drop in GLD. However, both mining ETFs recorded positive three-month returns over their respective reporting periods.
This difference reflects the additional business and equity-market risks associated with mining companies. Mining shares can outperform bullion during some periods and underperform it during others. Investors should compare fund structure, fees, volatility, and underlying holdings rather than relying on recent returns alone.
What to watch next for gold prices
The immediate test is whether gold can sustain a recovery above $4,000 or falls back towards its recent lows. The Federal Reserve's policy decision on October 28 and the US personal consumption expenditures (PCE) inflation report scheduled for October 29 could influence interest rate expectations, bond yields and the dollar. Check the official economic calendar before publication.
For GCC investors, Albilad Gold ETF offers a locally listed route to gold exposure, while GLD, GDX and GDXJ provide access to different US-listed strategies. Investors should compare underlying holdings, fees, currency exposure, and risk profiles rather than relying on recent returns alone.