Higher income often comes with higher credit risk, but CLO ETFs let investors choose where they sit on that trade-off. These funds provide exchange-traded access to collateralized loan obligations, a structured-credit market historically dominated by institutional investors. Today, CLO ETFs range from senior AAA-rated exposures to lower-rated mezzanine tranches, offering different combinations of income, credit risk, and interest-rate sensitivity. Here is how the key funds compare as of late September 2026.
What Are CLOs? Understanding Collateralized Loan Obligations
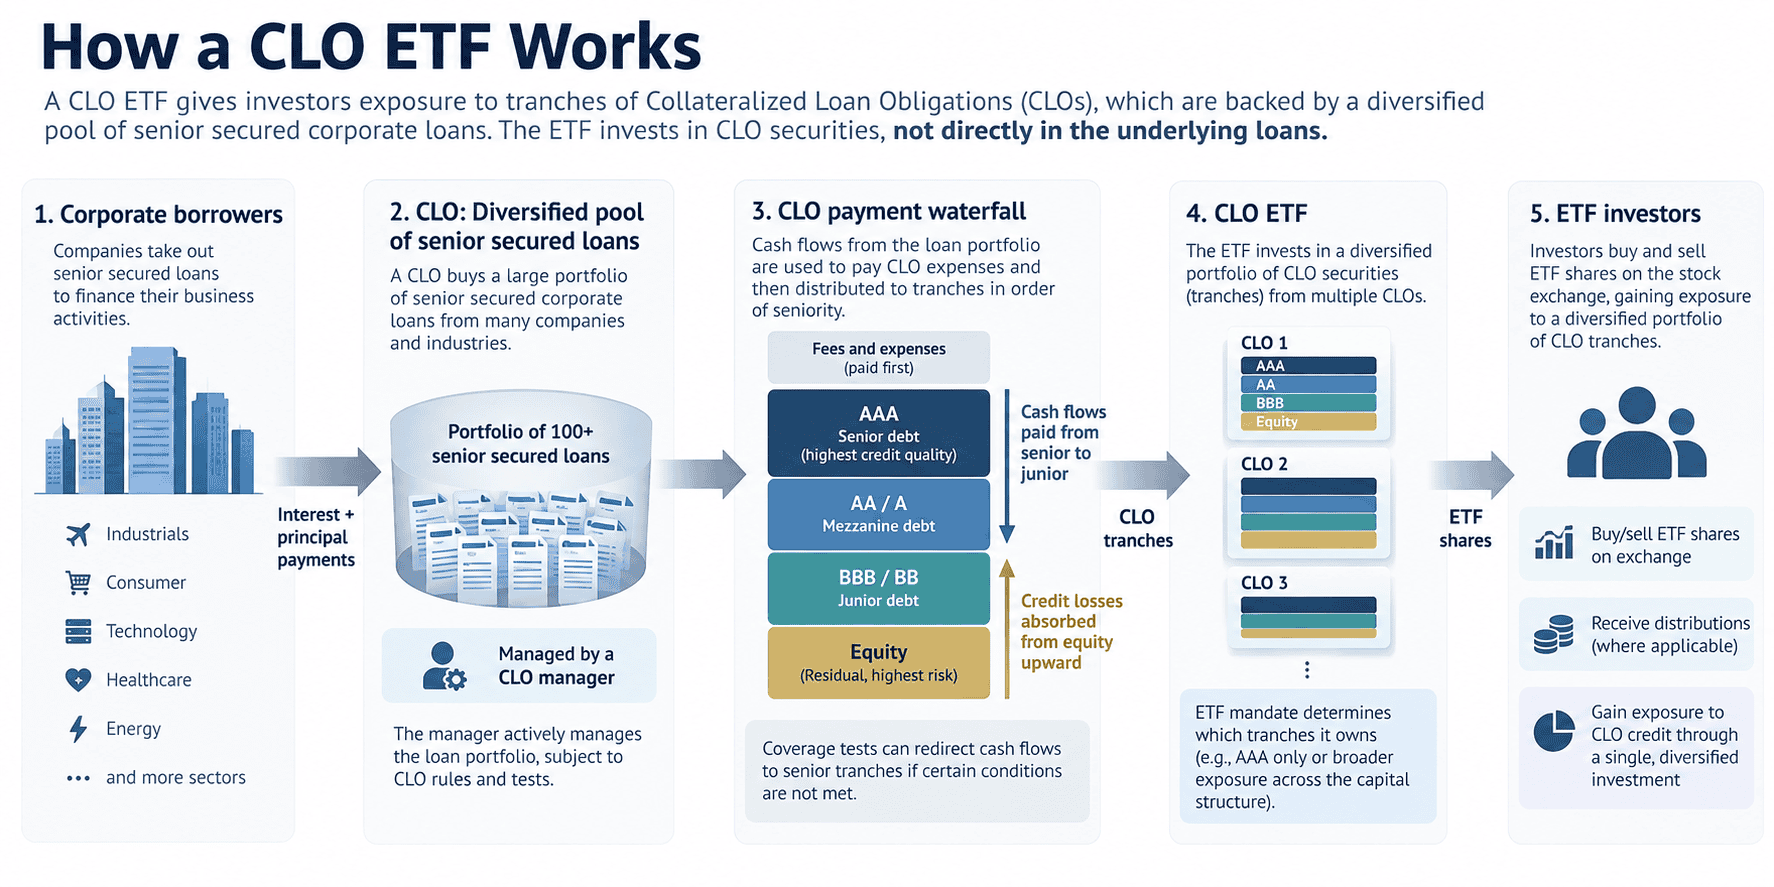
A company borrows money through a corporate loan. A large number of these loans are pooled together to form a collateralized loan obligation, or CLO. The CLO then issues different securities against the pool, known as tranches. The most senior tranche, typically rated AAA, generally has priority in receiving payments from the cash generated by the underlying loans. Junior tranches, down to the unrated equity piece, generally absorb losses first but offer higher potential income in exchange. A CLO ETF buys selected CLO securities, giving investors exchange-traded exposure to one or more parts of the CLO capital structure.
CLO Payment Waterfall and Tranche Structure
Cash from the underlying loans flows through the CLO in a set order, known as a waterfall. Senior tranches such as AAA generally receive payments first, while junior tranches generally absorb losses first. This subordination helps explain why a CLO's AAA tranche can carry a stronger credit rating than many of the loans underneath it: the junior layers provide a cushion before losses reach senior debt. The capital structure generally moves from more senior, higher-rated tranches toward lower-rated and junior tranches, with equity at the bottom.
What Do CLO ETFs Invest In?
A CLO ETF generally does not buy corporate loans directly. It buys securities issued by CLO structures, such as AAA, BBB, or BB tranches. In simple terms, the corporate loans are the underlying assets, the CLO packages them, and the ETF provides exchange-traded exposure to the tranches it holds.
Why AAA CLO ETFs Can Offer Higher Yields
An AAA rating applies to the CLO tranche, not to every loan underneath it. The underlying loan pool can therefore contain below-investment-grade loans even when the CLO tranche itself is rated AAA. Investors can still demand additional compensation because CLOs are backed by corporate loans and involve more structural and liquidity complexity than traditional government or investment-grade bonds. At the same time, subordination and other structural protections can help shield senior CLO tranches from losses in the underlying loan pool. A higher headline yield further down the CLO structure generally reflects greater exposure to credit losses and volatility, rather than a free increase in return.
CLO ETF Credit Risk and Default Exposure
A default by one company does not automatically mean every CLO investor loses money. Losses depend on the size of the default, recoveries on the loan, and where an investor sits in the capital structure. Junior tranches generally absorb losses first, though severe deterioration across the pool can eventually reach senior tranches too. Credit ratings are opinions of credit quality, not guarantees against losses.
Active Management in CLO ETFs
The funds discussed here are actively managed, meaning portfolio managers select CLO securities and adjust exposures within each fund's stated mandate.
CLO ETF Comparison: CLOA, CLOI, BCLO, CLOR and SPPB
Fund data below reflects the latest figures shown on the respective issuer pages, with dates noted where applicable.
CLOA is the largest fund in the group, with $2.34 billion in net assets. As of September 23, 2026, it held 422 positions with an effective duration of 0.08 years, indicating relatively low interest-rate sensitivity. Its year-to-date NAV return was 3.55 percent, close to its J.P. Morgan CLOIE AAA Index benchmark.
CLOI, VanEck's CLO ETF, had $1.64 billion in assets. As of August 31, 2026, its one-year NAV return was 5.25 percent, just below its J.P. Morgan CLO IG Index comparator benchmark's 5.26 percent return. Since inception, CLOI's annualized return was 7.14 percent, compared with 7.01 percent for the benchmark.
BCLO reaches further into BBB+ to B- rated CLO tranches. Its 30-day SEC yield of 6.44 percent and average yield to maturity of 7.31 percent reflect the higher credit risk associated with that lower-rated exposure. The fund held 57 positions as of September 23, 2026, compared with 422 positions for CLOA.
CLOR gives UCITS investors primarily AAA-rated CLO exposure, with a weighted-average yield to maturity of 5.38 percent as of September 23, 2026, while SPPB GY offers euro-denominated CLO exposure hedged back to USD, with total fund assets of roughly €286.55 million as of September 24, 2026.
Fidelity entered the category in February 2026 with FAAA and FCLO, both actively managed. FAAA generally invests at least 80 percent of its assets in AAA-rated CLOs, while FCLO invests the majority of its assets in CLOs rated BBB+ through B- or equivalent. Gross expense ratios are 0.20 percent for FAAA and 0.45 percent for FCLO after an initial fee waiver period.
How Do CLO ETF Yields Compare With Traditional Fixed Income?
CLO ETFs can offer yields that are competitive with traditional fixed-income funds, although the comparison depends on the tranche and the yield measure used. Around late September 2026, senior CLO ETFs such as CLOA and CLOI reported yields broadly in line with the broad U.S. bond market, while lower-rated CLO exposure such as BCLO offered a higher yield alongside greater credit risk. The comparison below also shows how these yields compare with investment-grade and high-yield corporate bond ETFs.
The comparison highlights an important point: CLOs do not automatically offer higher yields than every other fixed-income asset. Senior CLO tranches can provide competitive income with floating-rate exposure and structural protections, while lower-rated CLO tranches can offer higher yields in exchange for greater credit risk.
How Have CLO Impairment Rates Compared With Corporate Bonds?
Historical data also show why the credit rating of a CLO tranche cannot be assessed solely by looking at the underlying corporate loans. A Moody's-based comparison cited by Nuveen found 10-year cumulative impairment rates of 0.2 percent for investment-grade U.S. CLOs versus 2.2 percent 10-year cumulative default rates for global investment-grade corporate issuers. For speculative-grade exposures, the corresponding figures were 4.2 percent for CLOs versus 29.5 percent for corporate issuers. The periods and methodologies differ: the CLO data cover 1993 to 2023, while the corporate data cover 1998 to 2023. These figures therefore illustrate historical differences in impairment and default experience rather than providing a forecast of future losses.
These historical figures also help explain why senior CLO debt can offer relatively high income without carrying the same historical loss experience as similarly rated corporate debt. However, these historical impairment and default rates do not eliminate credit, liquidity, or market-value risk.
Why CLO ETFs can offer yield with lower interest rate sensitivity
Because the underlying loans generally pay floating rates, CLO securities typically have lower duration and less sensitivity to benchmark interest-rate changes than comparable fixed-rate bonds. For example, CLOA had an effective duration of just 0.08 years as of September 23, 2026, compared with 5.70 years for AGG and 7.61 years for LQD. This can reduce interest-rate sensitivity, but it does not eliminate risk: falling rates can reduce income, while rising rates can increase borrowing costs for the underlying companies and add credit stress. CLOs also use overcollateralization tests, which can redirect cash flows toward senior tranches once specified thresholds are breached. ETF shares trade on an exchange, but the underlying CLO market can become less liquid during periods of stress.
CLO ETFs and Lessons From the 2008 Financial Crisis
Corporate loan CLOs were different from the mortgage-linked CDOs that were central to the 2008 financial crisis. CLOs nevertheless experienced sharp price declines and widespread rating downgrades during that period. The episode shows that CLOs can see significant mark-to-market volatility even when ultimate credit losses remain limited.
Key Factors to Compare Across CLO ETFs
When comparing CLO ETFs, look beyond the headline yield to tranche exposure, yield methodology, credit quality, portfolio concentration, effective duration, fund and underlying market liquidity, expense ratio, and the degree of active management.
The bottom line
CLO ETFs give investors exchange-traded access to a complex structured credit market, and risk and income potential vary significantly depending on where a fund sits in the CLO capital structure. Tranche exposure, yield methodology, credit risk, and interest-rate sensitivity are therefore important considerations alongside the headline yield.