Three global Sukuk ETFs offer investors exposure to Shariah-compliant fixed-income securities, but their benchmarks, portfolio concentration, and trading characteristics differ. Lunate's SUKUK tracks the J.P. Morgan Global IG Sukuk Index and trades on the Abu Dhabi Securities Exchange (ADX), while HSBC's Global Sukuk UCITS ETF (HBKU) has the largest asset base among the three. iShares' $ Sukuk UCITS ETF (SKUK) tracks an emerging-market Sukuk benchmark and records the highest reported three-month average daily trading volume.
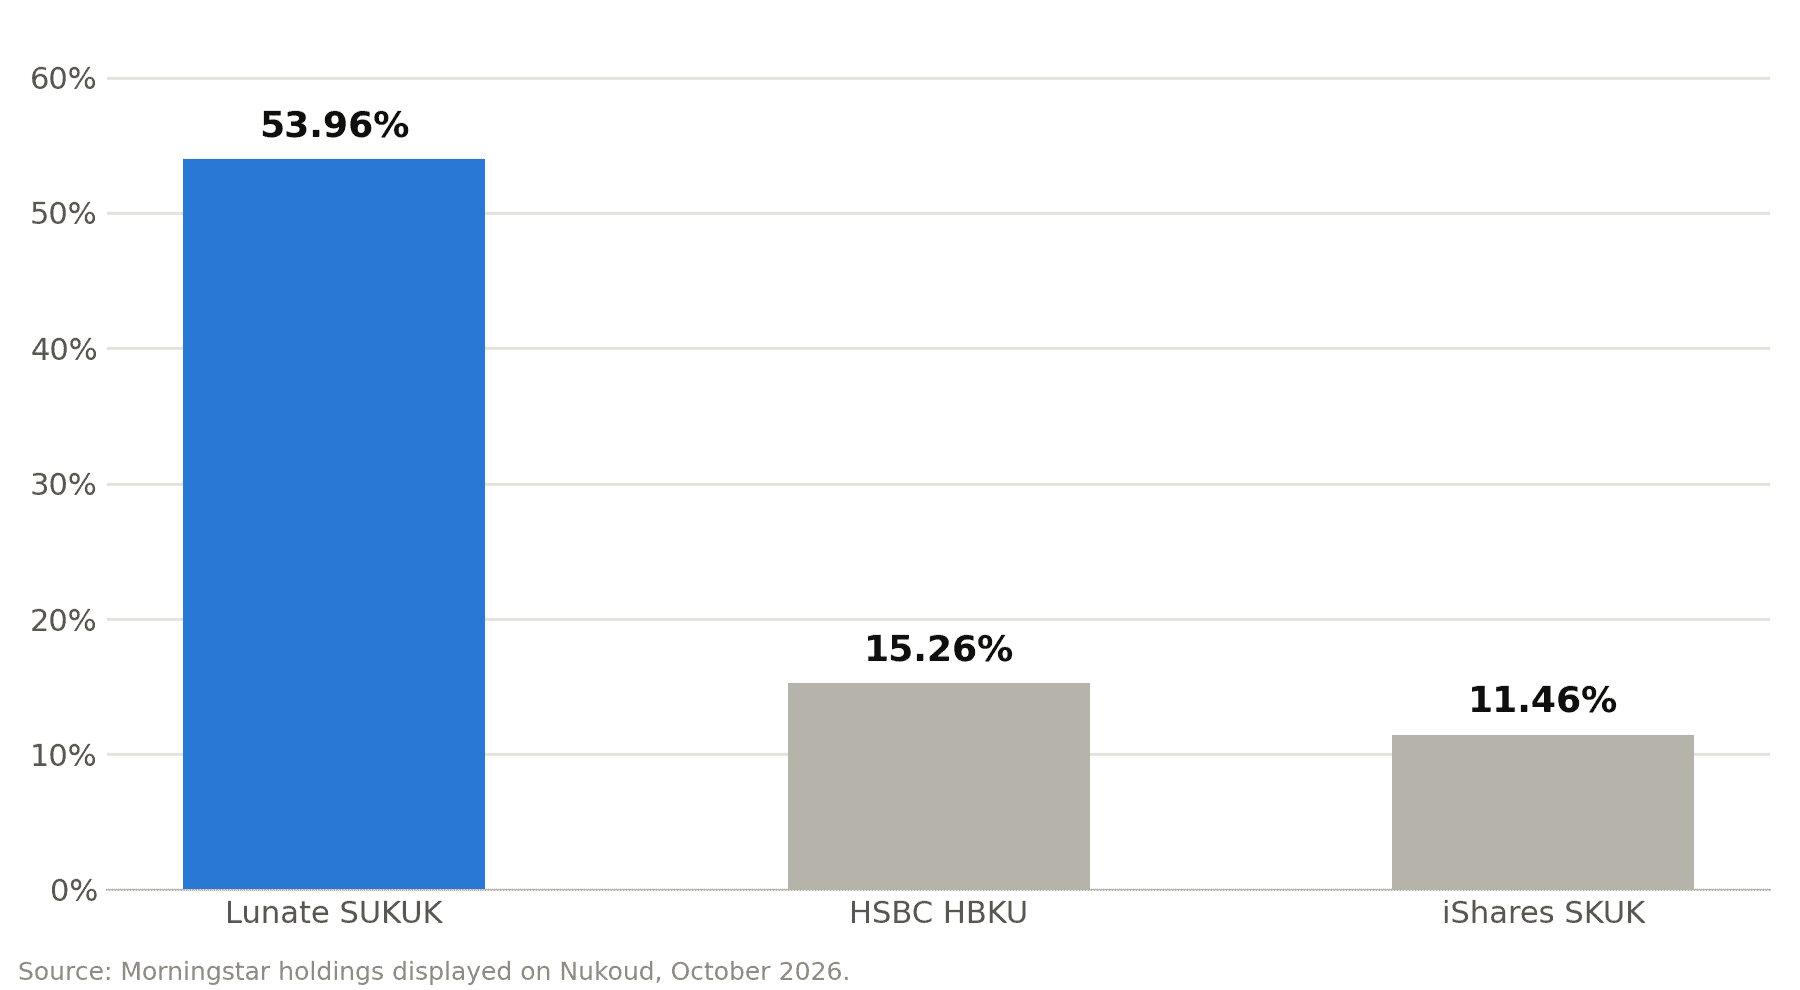
The funds also differ in portfolio concentration. Lunate's ten largest holdings account for 53.96% of its portfolio, compared with 15.26% for HSBC and 11.46% for iShares. These differences may affect issuer-level risk and portfolio diversification. This comparison uses Nukoud's ETF Compare tool, with fund figures as of October 27, 2026, and holdings and sector data based on the source dates stated below.
While Lunate's Global Sukuk ETF has a higher concentration in its top 10 holdings than its HSBC and iShares counterparts, its reported portfolio is predominantly investment grade, reflecting a generally strong credit-quality profile. Investors can explore all Global Sukuk funds available on Nukoud for further comparisons.
For a broader perspective, read Nukoud's Q3 2026 Quarterly Shariah ETF Report: Global Market Review with a GCC Investor Lens.
Fund overview and objective
Lunate JP Morgan Global Sukuk ETF Class B (SUKUK) launched on July 5, 2024, and trades in dirhams on ADX. HSBC Global Funds ICAV Global Sukuk UCITS ETF (HBKU) launched on September 7, 2023, while iShares $ Sukuk UCITS ETF (SKUK) launched on January 17, 2024.
Lunate tracks the J.P. Morgan Global IG Sukuk Index, which explicitly identifies an investment-grade Sukuk universe. HSBC follows the FTSE IdealRatings Sukuk Index, while iShares tracks the J.P. Morgan EM Aggregate Sukuk Index. The latter two benchmark names do not include the same explicit investment-grade designation, although benchmark names alone do not establish the funds' complete credit-quality profiles.
HSBC leads with US$592.19 million in assets, followed by iShares with US$208.75 million. Lunate holds AED 16.62 million, equivalent to approximately US$4.53 million at the AED 3.67-per-dollar exchange rate, making it substantially smaller than the other two funds.
Fund snapshot at a glance
Investment-grade vs. high-yield exposure
Investment-grade (IG) Sukuk are generally rated BBB− or higher by S&P and Fitch, or Baa3 or higher by Moody’s. High-yield (HY) Sukuk fall below these thresholds and generally carry greater credit risk.
The three ETFs have different reported credit-quality profiles. Lunate's September 2026 factsheet reports 58.6% A-rated, 37.1% BBB-rated, and 4.3% AA-rated holdings. All fall within investment-grade categories. HSBC's September 2026 factsheet reports 90.87% investment-grade ratings and 3.90% BB-rated holdings, alongside 0.86% unrated securities and 0.13% cash. iShares' September 2026 factsheet reports 71.42% investment-grade securities and 27.30% below-investment-grade securities.
Top holdings and portfolio concentration
The funds differ significantly in how their portfolios are distributed across individual Sukuk. Lunate's ten largest securities account for 53.96% of the portfolio, making it the most concentrated of the three by this measure. HSBC's top ten account for 15.26%, while iShares' top ten represent 11.46%.
Lunate SUKUK: Top ten holdings
HSBC HBKU: Top ten holdings
iShares SKUK: Top ten holdings
Lunate's holdings are more heavily concentrated in individual securities, including Sukuk associated with DP World, Saudi Electricity, and regional financial institutions. HSBC and iShares spread their holdings across a larger number of securities with smaller individual weights. However, top-ten concentration alone does not measure overall credit risk: issuer quality, maturity, duration, and exposure to common economic risks also matter.
Chart 1: Top-ten holdings as a percentage of portfolio assets
Sector allocation
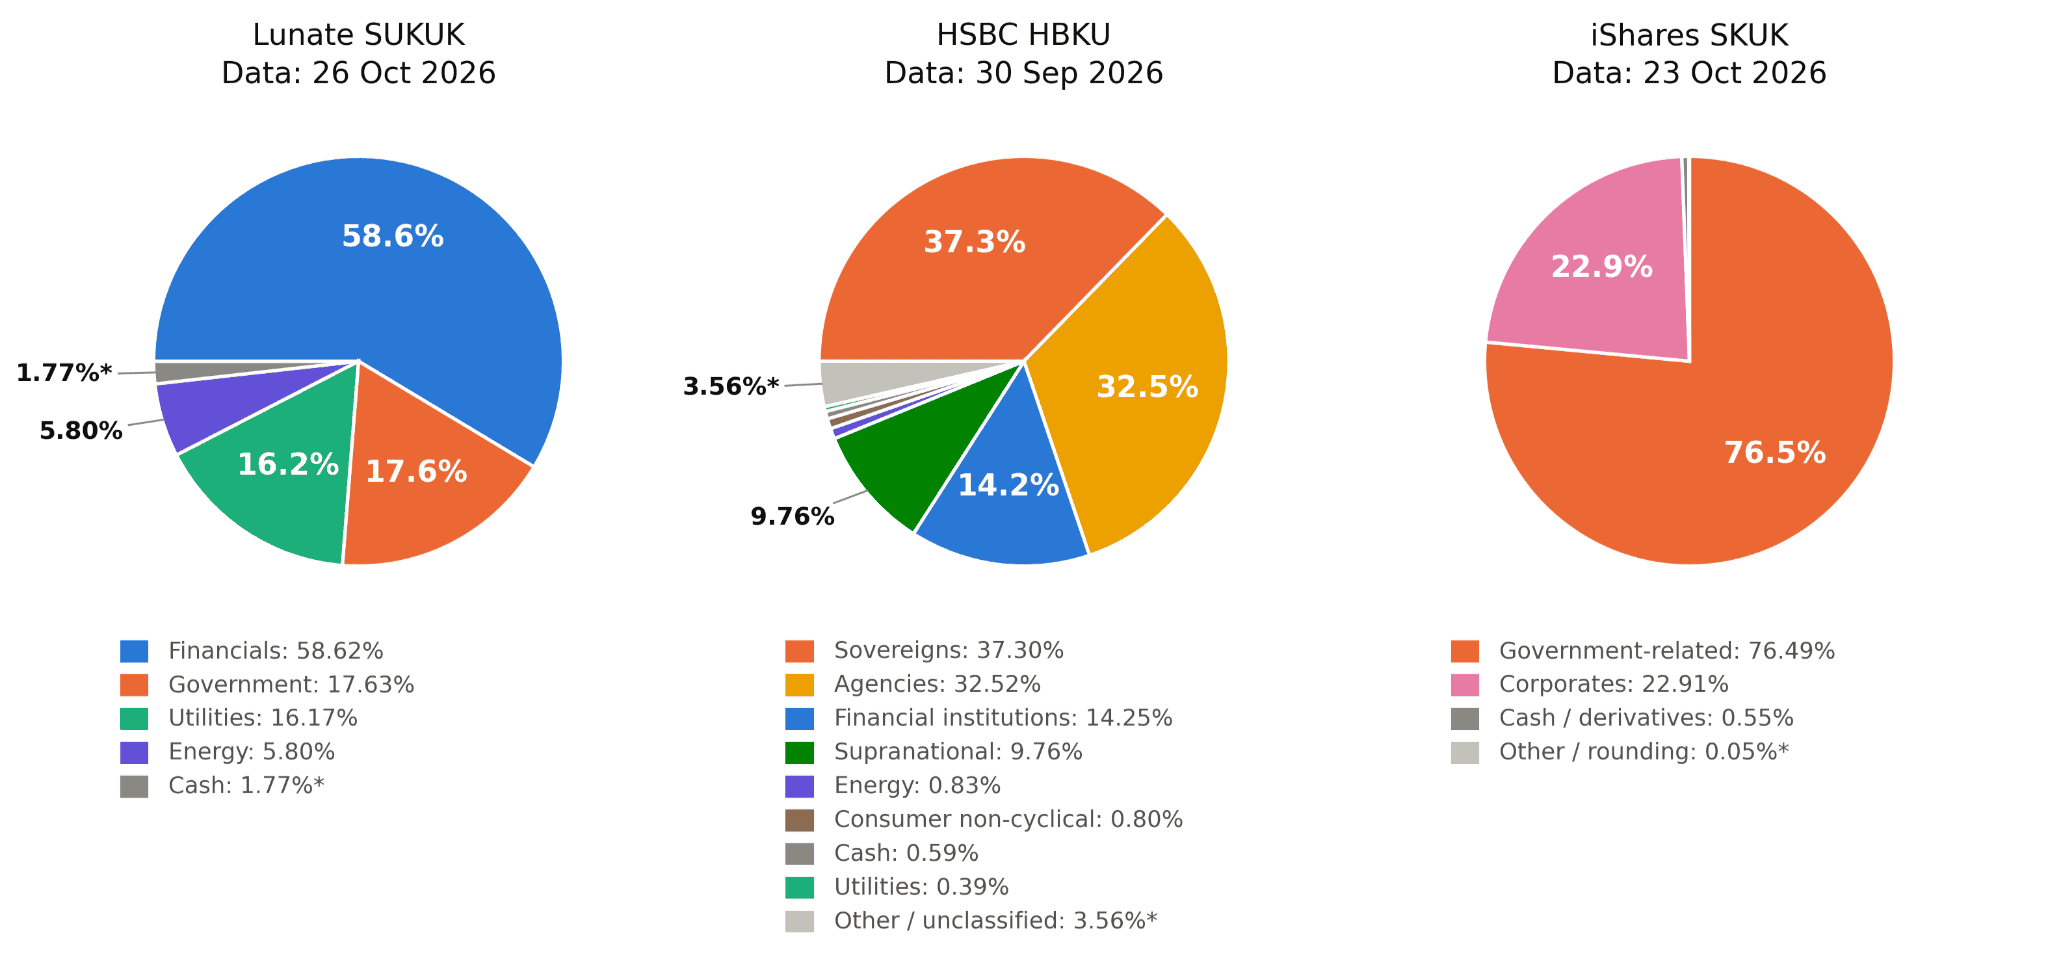
The three Sukuk ETFs differ in their exposure to financial institutions, sovereign and government-related issuers, utilities, and other sectors. Lunate's portfolio is dominated by financials, while HSBC has substantial exposure to sovereigns and agencies. iShares reports most of its portfolio under government-related securities, followed by corporate Sukuk.
Lunate's sector breakdown, as of October 26, 2026, shows financials at 58.62%, government at 17.63%, and utilities at 16.17%. HSBC's allocation, as of September 30, 2026, is led by sovereigns at 37.30% and agencies at approximately 32.52%, followed by financial institutions at approximately 14.25% and supranational issuers at approximately 9.76%. For iShares, the October 23, 2026, holdings data indicate 76.49% in government-related securities and 22.91% in corporates, with approximately 0.55% in cash and derivatives.
These classifications differ across providers: Lunate reports economic sectors, HSBC separates issuer categories, and iShares distinguishes government-related and corporate exposures. The figures are therefore indicative and should not be interpreted as a directly comparable sector breakdown.
Chart 2: Sector and issuer-type allocation across Lunate SUKUK, HSBC HBKU and iShares SKUK (%)
Performance comparison
Nukoud's trailing-return figures as of October 26, 2026, show negative year-to-date and one-year returns for all three funds. iShares recorded the smallest decline over both periods, while Lunate recorded the largest.
Chart 3: ETF performance overview: trailing returns (%)
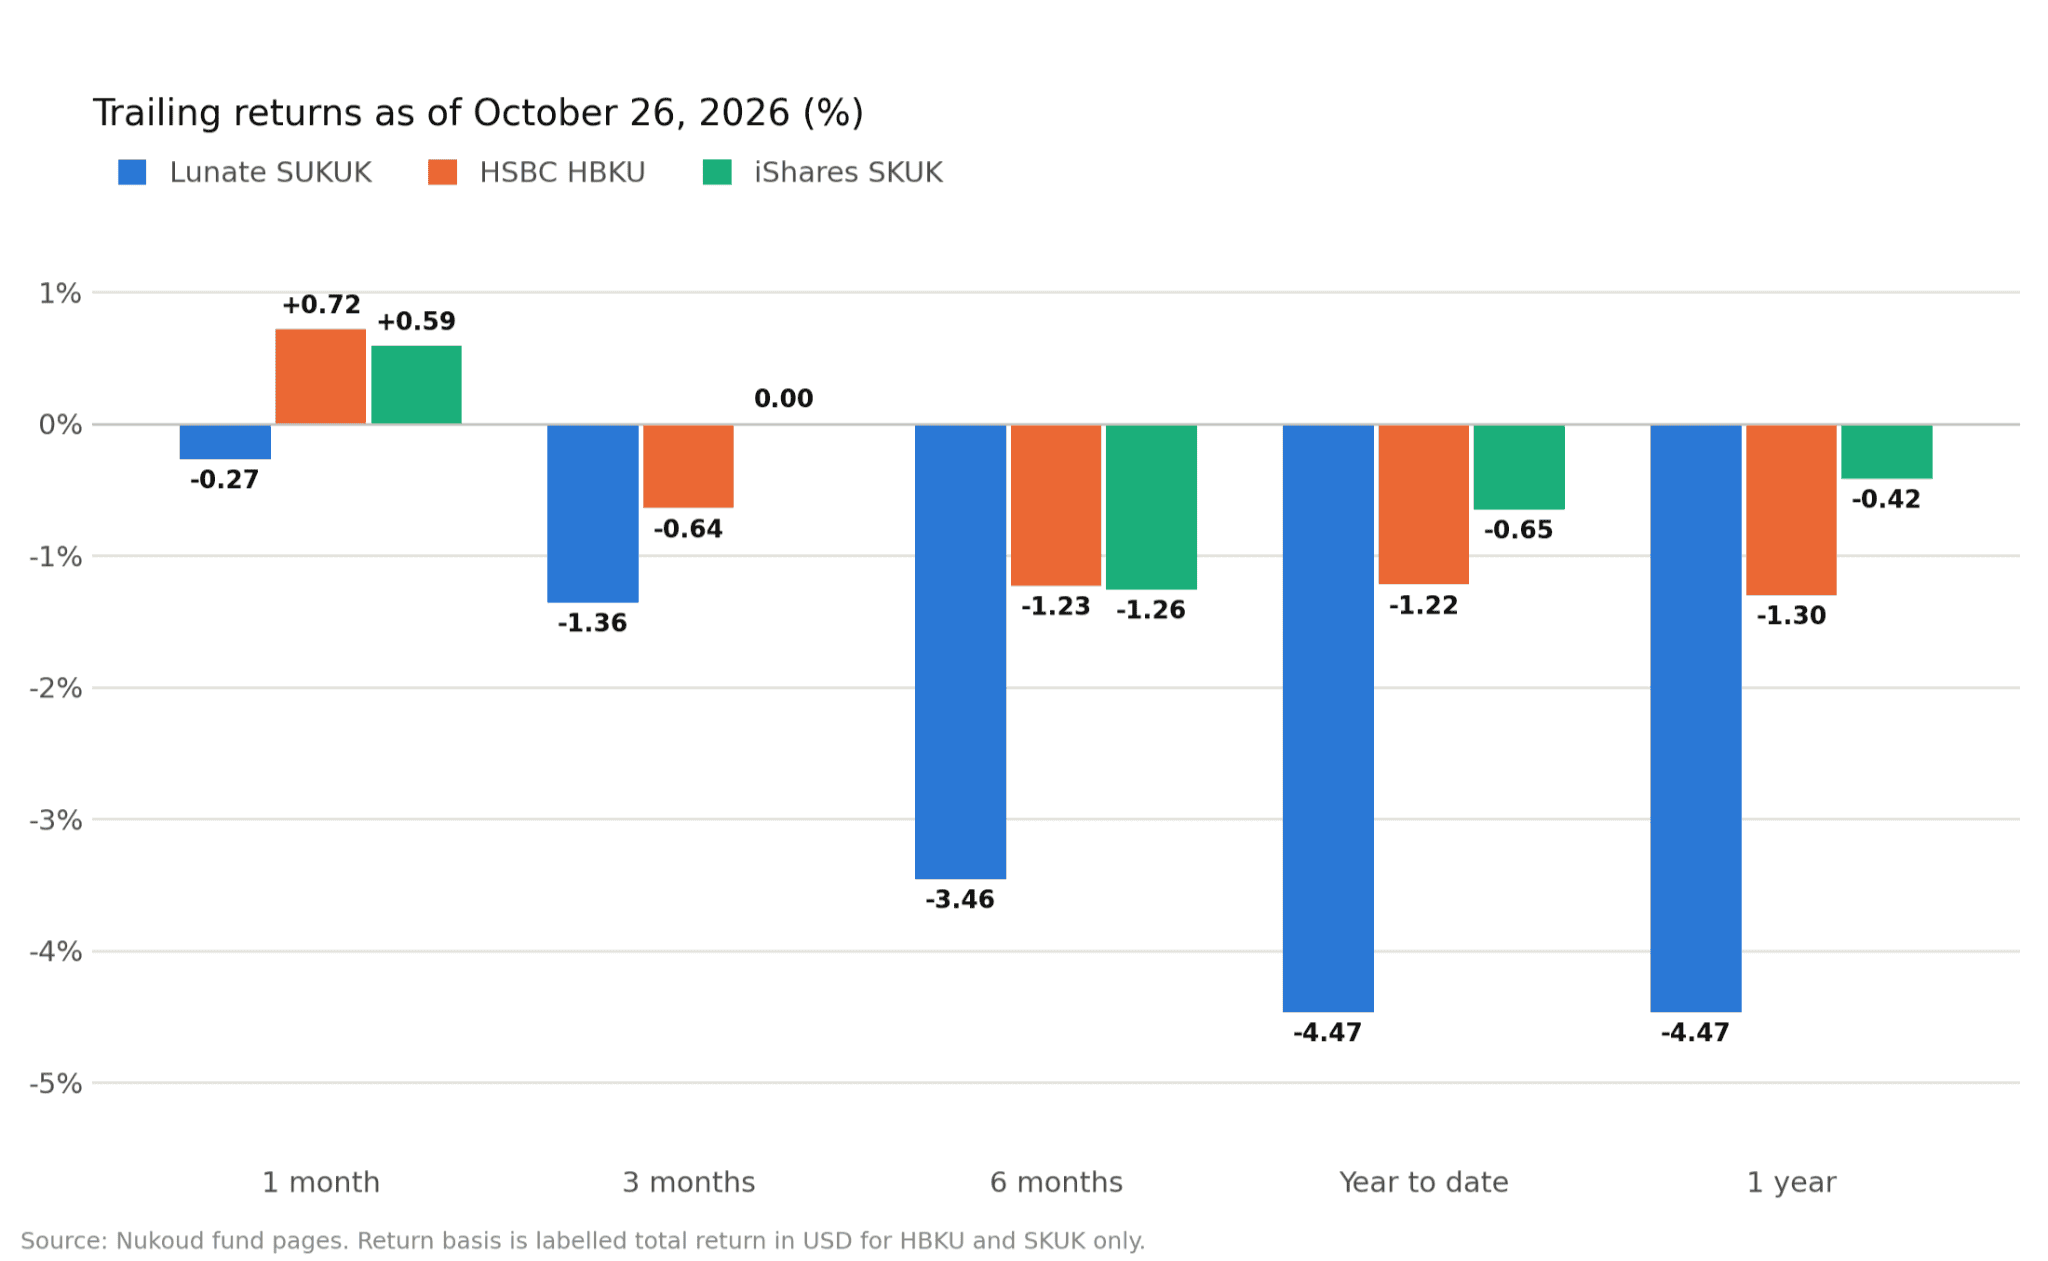
Source: Nukoud fund pages, as of October 26, 2026.
Lunate's year-to-date return trails HSBC by 3.25 percentage points and iShares by 3.82 percentage points. Over one year, iShares recorded a smaller decline than both peers.
These comparisons are indicative because the funds trade in different markets and currencies, and the return basis needs to be consistent. SUKUK trades in dirhams, whereas the HSBC and iShares data are reported in US dollars. Investors should also distinguish price returns from total returns, which include distributions.
HSBC is the only fund in this comparison with a three-year annualised figure in the displayed dataset, at 5.02%. Its calendar-year returns were 7.38% in 2025 and 2.84% in 2024. Historical returns do not guarantee future performance.
Fees and investment costs
Lunate SUKUK reports a total expense ratio (TER) of 0.40% per annum. HSBC Global Sukuk UCITS ETF (HBKU) has a reported ongoing charges figure of 0.37% per annum, while iShares $ Sukuk UCITS ETF (SKUK) reports a TER of 0.40% per annum.
HSBC has the lowest reported annual ongoing charge at 0.37%, compared with 0.40% for both Lunate and iShares.
Trading costs are another consideration. iShares has the highest reported three-month average daily volume at 29,800 shares, followed by Lunate at 12,800 and HSBC at 10,100. Average volume alone does not establish which fund is cheapest to trade; bid–ask spreads, order size, and market conditions also affect execution costs.
The three funds report portfolio yields of approximately 5.6% to 5.8%. However, Lunate reports an average yield, while HSBC and iShares report yield to maturity (YTM). The figures also reflect different reporting dates, so they are indicative rather than directly comparable. These yields are not guaranteed returns and may change with market prices and portfolio holdings.
Risk considerations
The three ETFs provide different approaches to global Sukuk exposure. Investors should consider the following factors before choosing between them:
- Credit quality: Lunate's benchmark explicitly identifies an investment-grade universe. The complete credit-rating distributions for all three funds should be checked in the latest issuer factsheets.
- Concentration: Lunate's ten largest holdings represent 53.96% of its portfolio, making its largest positions particularly important to monitor.
- Interest-rate sensitivity: Effective duration and maturity profiles help assess how Sukuk prices may respond to changes in market yields.
- Geographic and issuer exposure: Saudi Arabian, UAE, Indonesian and other international issuers may contribute differently to each portfolio's risk and return.
- Trading and currency costs: Listing venue, bid–ask spreads, brokerage access and currency conversion can affect realised investor returns.
The bottom line
Lunate, iShares and HSBC offer different routes to global Sukuk exposure. Lunate provides an ADX-listed option linked to an explicitly investment-grade benchmark, but it has the smallest reported asset base and the highest concentration among its ten largest individual securities. HSBC has the largest AUM and the longest performance history in this comparison, while iShares has the highest reported three-month average daily trading volume and the smallest reported year-to-date decline.
No single fund is the universal winner. Investors should assess benchmark methodology, credit quality, portfolio concentration, duration, fees, and trading costs alongside their own objectives. A definitive sector comparison requires verified, consistently dated sector-allocation data for all three funds.