

For investors in the GCC looking for Shariah-compliant access to US equities, SPUS and HLAL are two of the most prominent ETF options. Both provide diversified exposure to US stocks while applying Shariah screens, but they differ in sponsor, benchmark construction, sector tilt, cost, and performance. Here's how SP Funds S&P 500 Sharia Industry Ex ETF (SPUS) stacks up against Wahed FTSE USA Shariah ETF (HLAL).
The comparison below uses the latest data from Nukoud's ETF Compare tool as of August 26, 2026.
Fund Overview and Objective
Both funds are US-domiciled, USD-denominated equity ETFs classified as Sharia-compliant, with several years of live market history apiece. HLAL launched first, on July 16, 2019, followed by SPUS roughly five months later, on December 17, 2019.
SPUS tracks the S&P 500 Shariah Industry Ex index, screening the S&P 500 universe down to roughly 200 stocks that meet Shariah-compliance criteria, including a low-leverage screen based on debt-to-market-capitalization. The fund is advised by Tidal Investments LLC, with ShariaPortfolio, Inc. serving as sub-adviser for Shariah-related guidance.
HLAL tracks the FTSE USA Shariah index, drawn from the large- and mid-cap FTSE Global Equity universe and screened by Yasaar Limited, with the index series certified Shariah-compliant via fatwa. The fund is advised by Wahed Invest LLC.
The core structural difference is index construction. SPUS starts with the S&P 500 universe, while HLAL uses the large- and mid-cap stocks in the FTSE Global Equity Index Series. The resulting portfolios have different sector and investment-style exposures: SPUS is currently classified as Large Growth, while HLAL is classified as Large Blend.
Fund Snapshot at a Glance
Top Holdings and Portfolio Concentration
The two ETFs have substantial overlap among their largest holdings, with NVIDIA, Apple, Microsoft, Alphabet, and Broadcom appearing in the top five positions of both portfolios. The remaining positions show some variation, with SPUS including Micron Technology, Eli Lilly, Tesla, Advanced Micro Devices, and ExxonMobil, while HLAL's top 10 includes Alphabet Class C and Meta Platforms. The top 10 holdings account for 56.20% of SPUS and 58.08% of HLAL, highlighting the importance of their largest positions within each portfolio.
Top 10 Holdings: SPUS vs. HLAL
Sector Allocation and Investment Style
The sector breakdown helps explain the growth-versus-blend classification: SPUS runs nearly 60% Technology with a thinner Communication Services sleeve, while HLAL holds relatively less Technology but roughly 2.5x the Communication Services weight, giving it a somewhat different sector profile. Neither fund currently carries Financial Services exposure, reflecting the exclusion of conventional interest-based financial businesses under their Shariah screening methodologies.
Performance Comparison
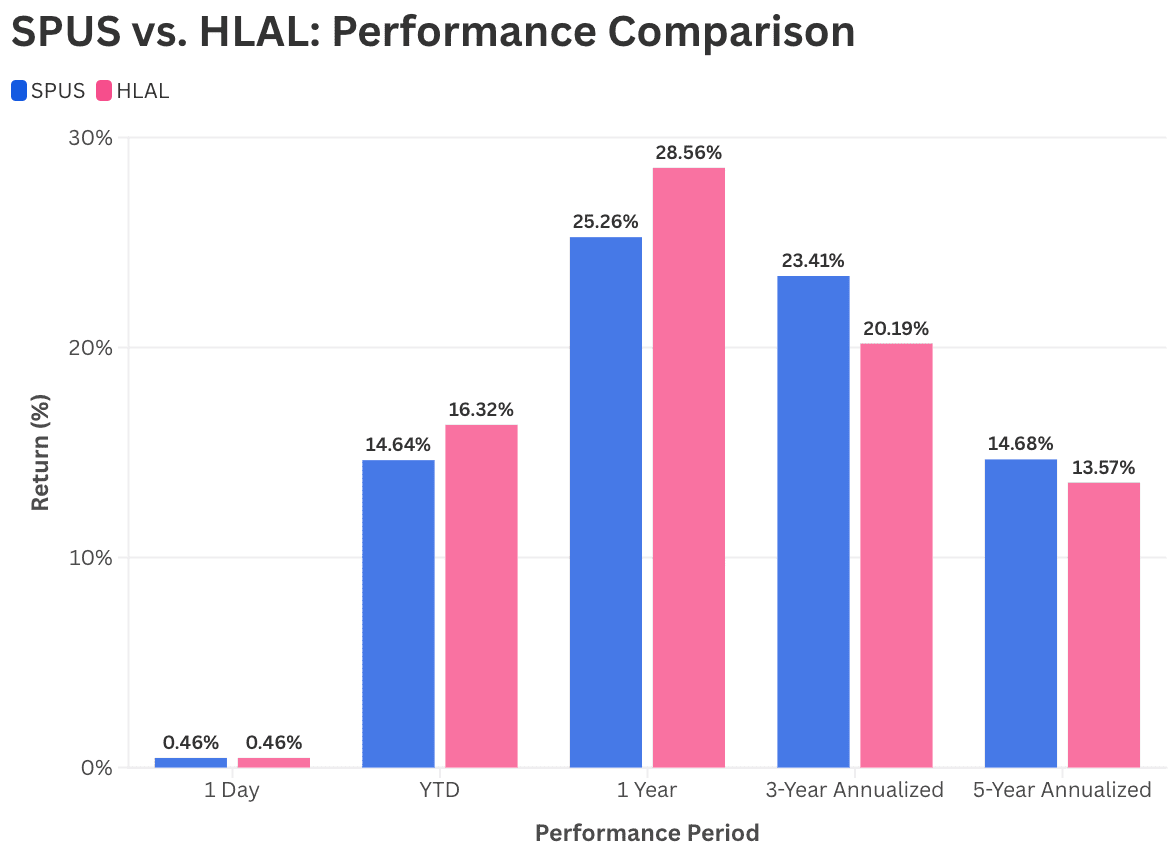
The two funds' returns differ by measurement period: HLAL's YTD and one-year returns are 1.68 and 3.30 percentage points higher than SPUS's, respectively, while SPUS's three-year and five-year annualized returns run ahead of HLAL's 23.41% versus 20.19% over three years, and 14.68% versus 13.57% over five years.
The difference in returns is consistent with the funds' different portfolio and sector exposures. SPUS is currently classified as Large Growth, while HLAL is classified as Large Blend, and their sector allocations differ meaningfully, particularly in Technology and Communication Services. These differences can contribute to variations in performance over individual periods.
Fees and Investment Costs
The 5-basis-point gap noted in Key Stats holds consistently across net expense ratio, gross expense ratio, and management fee. Over long holding periods, small differences like this compound. On a $100,000 investment, the 5-basis-point annual difference initially amounts to $50 a year before considering the effect of investment growth and compounding.
Key Metrics at a Glance
SPUS has a larger asset base, with $3.09 billion in AUM versus $936.84 million for HLAL. It also records significantly higher three-month average trading volume, at 478,000 shares compared with 61,000. SPUS has a slightly lower expense ratio of 0.450% versus 0.500% for HLAL. The ETFs’ market prices, at $56.34 and $69.93, respectively, are not directly comparable because share prices can vary based on each fund’s structure and number of shares outstanding.
The Bottom Line
SPUS and HLAL both provide Shariah-compliant exposure to US equities, with substantial overlap among their largest holdings but meaningful differences in index construction, sector allocation, fees, liquidity, and recent performance.
As of August 26, 2026, SPUS had the larger asset base, higher average trading volume, and lower expense ratio, while HLAL had stronger YTD and one-year returns. SPUS, however, had the stronger three- and five-year annualized returns in the comparison data.
The two ETFs therefore offer similar core exposure but different portfolio characteristics. SPUS is currently classified as Large Growth, while HLAL is classified as Large Blend, and their sector allocations differ notably. For investors comparing the funds, index methodology, portfolio concentration, costs, liquidity, and investment horizon are more useful decision points than any single recent performance figure.