WTI crude fell below $90 a barrel and remained around the $90 threshold on Wednesday, while Brent crude traded above $100. The divergence highlights the sharp shifts taking place in the oil market as improving Middle East supply flows compete with renewed geopolitical and weather-related risks. WTI and Brent are different crude benchmarks, so a move below $90 in WTI does not mean Brent must trade at the same level. Brent has moved between $95.41 and $108.75 in daily closing data since September 7, and the volatility is spilling into oil ETFs in very different ways.
The move also shows why oil exposure is not a single trade for investors. Crude-futures ETFs, oil-producer ETFs and oil-services ETFs can respond differently to the same change in oil prices, depending on the assets they hold and the factors affecting their underlying investments.
Why Did WTI Fall Below $90?
WTI fell below $90 as the market began pricing in an improvement in near-term oil supply. Gulf oil flows excluding Iran were recovering, reaching more than 81% of pre-war levels in September, led by a recovery in Saudi exports.
The G7's agreement to release 100 million barrels of crude and diesel from emergency reserves added to expectations that additional supply would become available. The announcement reduced some of the immediate supply premium in the market, although the precise details of the release were still being finalized.
The improvement in physical flows also weighed on prices. Vitol estimated that around 12 million barrels per day of crude and 2 million barrels per day of refined products had left the Middle East over the previous seven to 10 days. Saudi Arabia also reported that its East-West pipeline had reached 5.8 million barrels per day.
WTI settled at $89.43 on October 5 and $89.44 on October 6, moving below the $90 threshold. Brent, meanwhile, closed above $100 on both days, highlighting the different price levels of the two benchmarks.
How Volatile Was Brent During the Period?
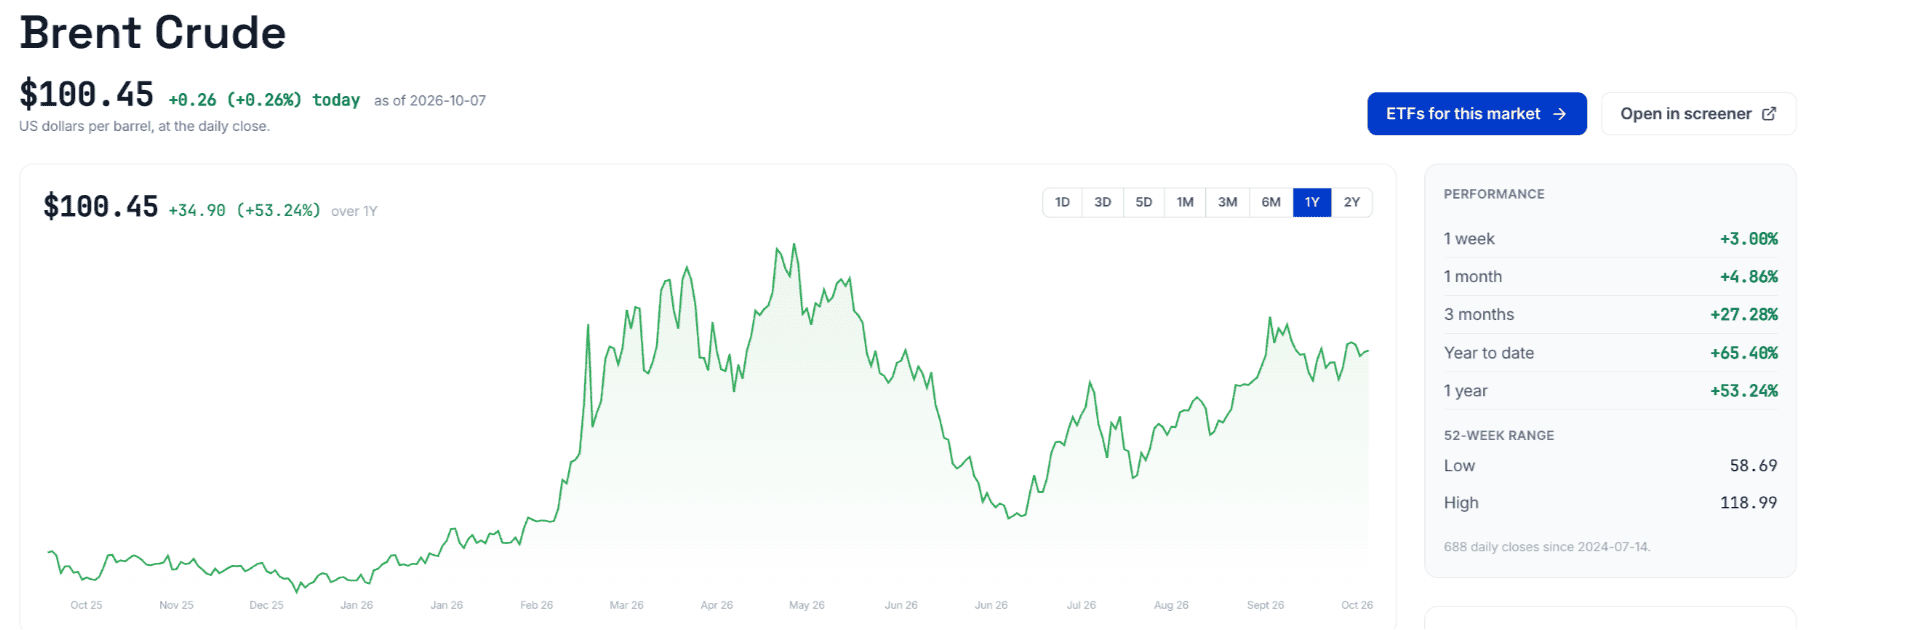
Brent futures remained well above the $90 level in the daily closing data from September 7 to October 7. It moved between a closing low of $95.41 and a closing high of $108.75, before ending the period at $100.45. The benchmark therefore experienced substantial volatility without approaching the $90 level on a closing basis.
Brent Oil Price Over the Past Month
Why Did Brent Hold Higher?
Brent is the major international seaborne crude benchmark and is more directly exposed to risks around Middle East exports and shipping routes. WTI is more closely linked to the U.S. crude market and the physical market around Cushing, Oklahoma. As a result, improving Middle East flows can ease the global supply premium without eliminating the geopolitical risk embedded in Brent.
Why Did Oil Rebound?
The decline in WTI was followed by a rebound as new supply risks emerged. A storm forming in the Gulf of Mexico threatened offshore oil and gas production and could affect up to six refineries. The areas in the storm's path account for about 15% of US crude production and 5% of US natural gas production.
At the same time, renewed attacks by Yemen's Houthis on Saudi Arabia increased concerns about further disruption to Middle East energy supplies. The risks offset some of the pressure from recovering regional oil flows and the planned G7 reserve release.
By Wednesday, WTI was back around the $90 level while Brent was above $100. The reversal shows how quickly the market can shift between supply concerns and expectations of improving availability.
What Does the Oil Reversal Mean for GCC Investors?
For GCC investors, the distinction between Brent and WTI matters because Brent is widely used as a reference for international and GCC oil markets, while WTI's move below $90 illustrates the volatility in another major crude benchmark.
Higher oil prices can influence government revenues, fiscal spending, and economic activity across the GCC, while energy companies account for a significant share of several regional equity markets. However, a move in Brent does not automatically translate into an equivalent gain in GCC stocks or ETFs. Production levels, fiscal policy, valuations and company-specific earnings can all influence the response.
The latest reversal therefore matters beyond the crude market. A sustained period of Brent above $100 could support government revenues and energy-sector earnings, while a sharp reversal could pressure fiscal expectations and oil-related equities. For investors using GCC-listed ETFs, fund composition also matters because exposure to energy companies, banks, and other sectors can produce very different responses to changes in crude prices.
How Did Oil ETFs Respond to the Crude Reversal?
USO, IEO, and IEZ YTD figures are as of October 5, and OIH is as of October 6. †: figures as of August 31, the latest period the provider pages show, and XOP YTD is also as of August 31, so the table is not a same-day ranking. Return measures also differ by provider.
USO provides the most direct oil-price exposure in this group, although it tracks short-term WTI crude futures rather than Brent. It fell 2.29% on October 5, the day Brent closed down 1.89%, and 4.01% over the week to that date. It is still up 38.48% over three months, and its last trade of $144.91 sits about 10% below the 52-week high of $161.86. Its 0.86% expense ratio is more than double the 0.35% on OIH and XOP.
Equity ETFs do not move one-for-one with crude. OIH drops 8.44% over the month to October 6, even as Brent is about 3.7% higher over the corresponding period, and it falls 0.82% on October 6 when Brent gains 0.26%. The data does not explain the gap, but it shows that oil-services ETFs can diverge significantly from the spot price of crude. Producers and services also diverge on the same day. On October 6, IEO's NAV rises 0.54% while IEZ's NAV falls 0.46%.
IEO shows the highest reported YTD return among the funds in the table, although the figures are not directly comparable because several provider figures are as of August 31. Its NAV of $139.62 sits within about 4% of the top of its 52-week range at $144.79. IEZ, at a NAV of $27.40, is about 16% below its 52-week high of $32.53. XOP is the largest of the equity funds with $4.11 billion in assets as of October 5, but its latest published returns run only to August 31, so a direct comparison needs updated figures.
Key Oil Market Drivers for ETF Investors
The EIA inventory figure today, the hurricane track and any refinery shutdowns, diesel inventories, the IEA meeting next week, and the fighting between Saudi Arabia and the Houthis will help determine whether Brent holds near $100. A storm that disrupts Gulf output could support crude prices, while damage to Gulf refineries and offshore infrastructure could have different effects across oil producers and oil-services companies. The EIA expects global liquid fuels production to average 101.1 million bpd in 2026, compared with consumption of 102.4 million bpd, before production rises to 109.6 million bpd in 2027 against consumption of 104.6 million bpd. The agency expects Brent to average $105 a barrel in the fourth quarter of 2026 and $96 for the full year, before falling to an average of $84 in 2027 as Middle East supply recovers and inventories rebuild. However, the October forecast was finalized on October 1 and does not account for any additional crude or petroleum products that could enter the market following the G7's October 2 reserve-release announcement.