Two Saudi-listed ETFs offer exposure to Hong Kong and China equities but follow different investment approaches. Albilad CSOP MSCI Hong Kong China Equity ETF (9410) tracks the MSCI HK China Connect Select Index and applies Shariah screening, while SAB Invest Hang Seng Hong Kong ETF (9411) tracks the Hang Seng Index through the Hong Kong Tracker Fund (TraHK).
Their different screening approaches and sector allocations create distinct exposures, particularly to financials, information technology, healthcare, and industrials, which may help explain differences in historical performance. This comparison uses Nukoud's ETF Compare tool, with fund figures as of October 11, 2026, and holdings and sector data based on the source dates stated below.
Fund overview and objective
Both funds are passive, SAR-denominated equity ETFs listed in Saudi Arabia. Albilad CSOP launched on October 30, 2024, while SAB Invest reports an inception date of October 28, 2024, and began trading on the Saudi exchange on October 31, 2024.
Albilad CSOP tracks the MSCI HK China Connect Select Index and applies Shariah screening criteria defined by the fund manager's Shariah Committee. SAB Invest follows the Hang Seng Index through a fund-of-funds structure, investing in the Hong Kong Tracker Fund (TraHK), which tracks the same index. The funds therefore provide exposure to Hong Kong and China equities through different portfolio structures. Albilad CSOP is identified as Shariah-compliant. Investors with specific Shariah requirements should consult the latest official fund documentation for confirmation of each fund's status.
Albilad CSOP reports assets under management of SAR 4.93 billion and a three-month average daily trading volume of 11,700 shares, compared with SAR 2.37 billion and 2,100 shares for SAB Invest. These figures provide a snapshot of the funds' size and trading activity as of October 11, 2026. Investors can also consider bid-ask spreads when assessing trading costs.
Fund snapshot at a glance
*SAB Invest follows a fund-of-funds structure and invests through the Hong Kong Tracker Fund (TraHK). The reported 0.25% expense ratio excludes the underlying ETF's fees and expenses.
Top holdings and portfolio concentration
The supplied Albilad Capital factsheet lists 30 holdings but does not specify an as-of date, so its portfolio weights are indicative. The ten largest listed holdings account for 59.28% of the portfolio, according to the factsheet. SAB Invest invests through the Hong Kong Tracker Fund (TraHK), which tracks the Hang Seng Index. The index's ten leading constituents account for 49.19% of its weight in the May 2026 data. These index weights indicate SAB Invest's benchmark exposure rather than a direct breakdown of its ETF holdings. The two lists of ten leading constituents share no names.
Sector allocation
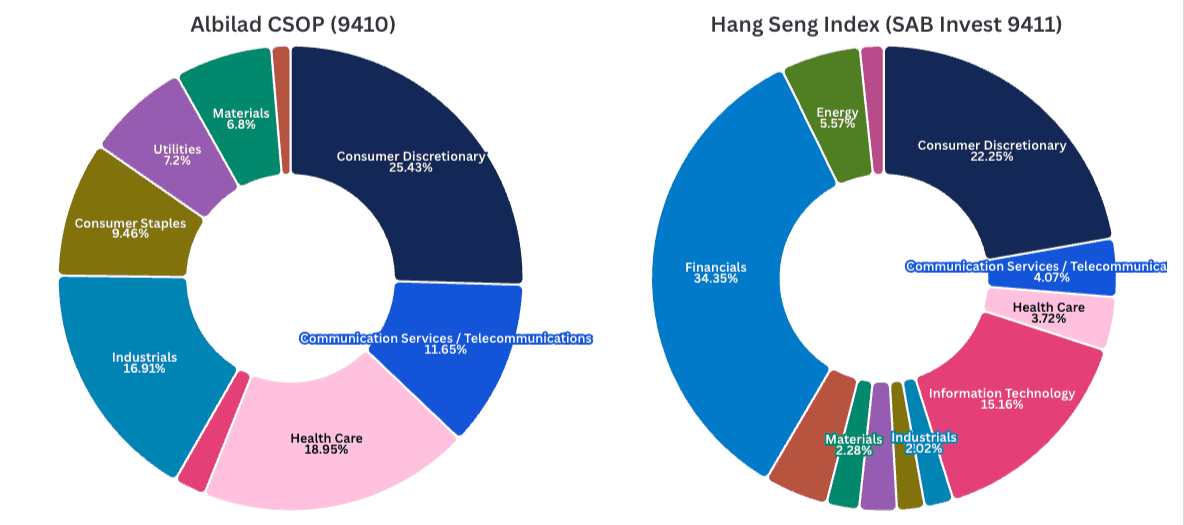
The Albilad CSOP weights are calculated from the undated factsheet, while the Hang Seng Index weights are from May 2026.
The Albilad CSOP factsheet shows its largest sector allocations in consumer discretionary (25.43%), health care (18.95%), and industrials (16.91%). In the May 2026 Hang Seng Index data, financials account for 34.35%, followed by consumer discretionary at 22.25% and information technology at 15.16%. China Shenhua Energy is classified as Materials in the Albilad factsheet, so the absence of a separately classified Energy category does not necessarily mean there is no exposure to energy-related businesses. Sector labels and classifications differ between the sources, and the data refer to different dates, limiting direct comparisons.
Differences in sector exposure may contribute to the ETFs' varying returns across periods. However, sector allocations alone cannot establish which sectors drove performance. A more detailed assessment would require comparable sector-index returns over the same periods as the ETF performance figures.
*Sector classifications differ between the sources. Albilad CSOP figures are aggregated from an undated factsheet, while Hang Seng Index figures are from May 2026. The figures are indicative and are not perfectly comparable across all categories.
Chart 1: Sector Allocation: Albilad CSOP vs. SAB Invest (%)
Performance comparison
Chart 2: ETF Performance Overview: Trailing Returns (%) as of October 11, 2026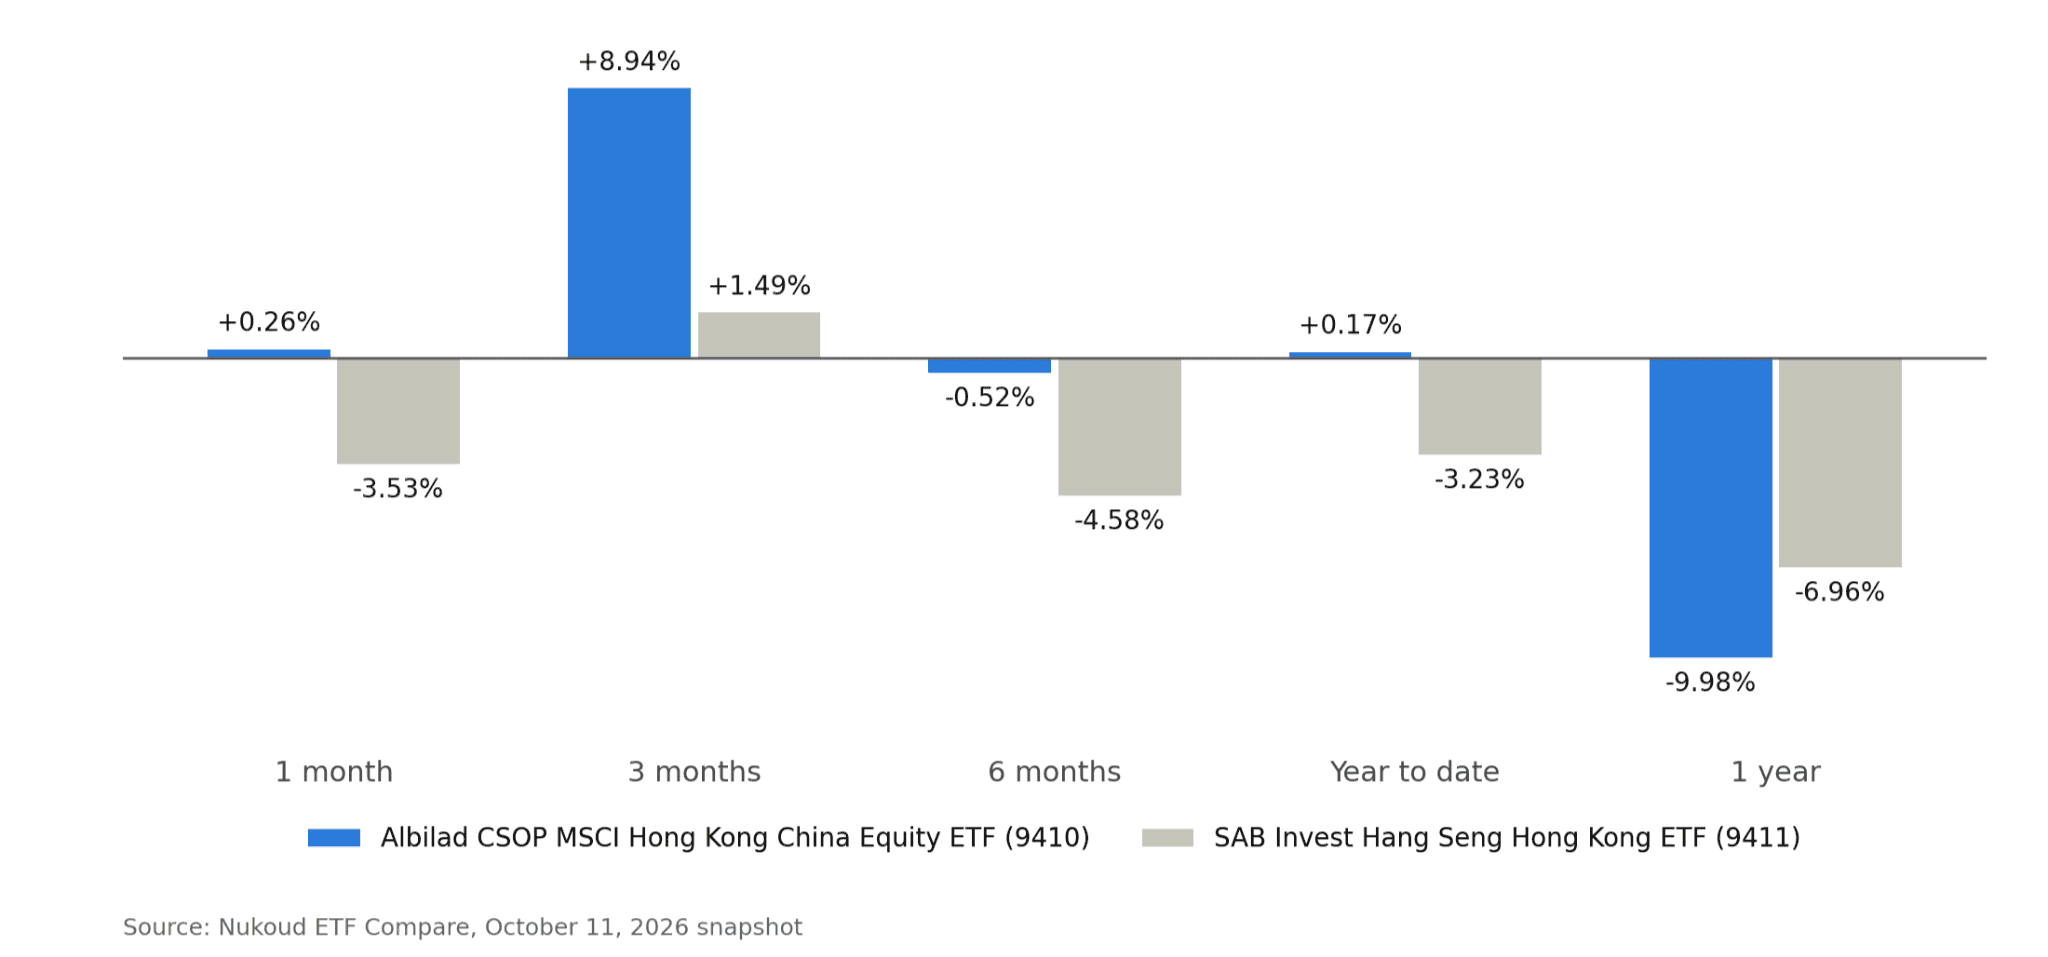
As of October 11, 2026, Albilad CSOP recorded higher returns over one, three, and six months and year-to-date. Its year-to-date return was 3.40 percentage points above SAB Invest's. Over one year, however, SAB Invest recorded the smaller decline, at 6.96% compared with 9.98% for Albilad CSOP. Both funds had negative one-year returns.
Their different sector exposures are an important factor when interpreting these results. The Hang Seng Index has substantially greater exposure to financials and information technology, while Albilad CSOP has greater reported exposure to healthcare and industrials and applies Shariah screening. Because these sectors and their underlying companies can perform differently across market cycles, the funds' portfolio compositions can contribute to divergent returns. However, the figures shown do not quantify how much of the performance difference came from any individual sector.
Three- and five-year returns are unavailable because both funds launched in late 2024. Historical returns do not account for an individual investor's trading costs or taxes. Reported one-year standard deviations are 20.77 for Albilad CSOP and 17.51 for SAB Invest; these figures should be compared only if their measurement periods and methodologies are consistent.
Fees and investment costs
The reported net expense ratios are 0.75% for Albilad CSOP and 0.25% for SAB Invest, a difference of 0.50 percentage points. SAB Invest uses a fund-of-funds structure, investing through the Hong Kong Tracker Fund (TraHK). Its reported fee should not be treated as the total cost of the underlying investment, as TraHK has its own charges. SAB Invest's official fund page separately lists a 0.10% annual management fee. Because these figures represent different fee measures, they do not provide a fully reconciled comparison of total investor costs.
Risk considerations
Both ETFs are exposed to Hong Kong and China equity market fluctuations, but their benchmarks and portfolio structures differ. Investors should consider concentration, trading costs, total investment costs, and their own investment objectives when assessing either fund.
The bottom line
The key distinction between Albilad CSOP and SAB Invest is their underlying sector exposure, not simply their shared focus on Hong Kong and China equities. Albilad CSOP applies Shariah screening and has greater reported exposure to healthcare, consumer discretionary and industrials, while the Hang Seng Index has much larger allocations to financials and information technology. These structural differences can contribute to divergent returns, as reflected in the funds' varying performance across the periods shown. Investors should assess the benchmark, sector exposure, Shariah requirements, costs, and investment objectives before choosing between the two ETFs.